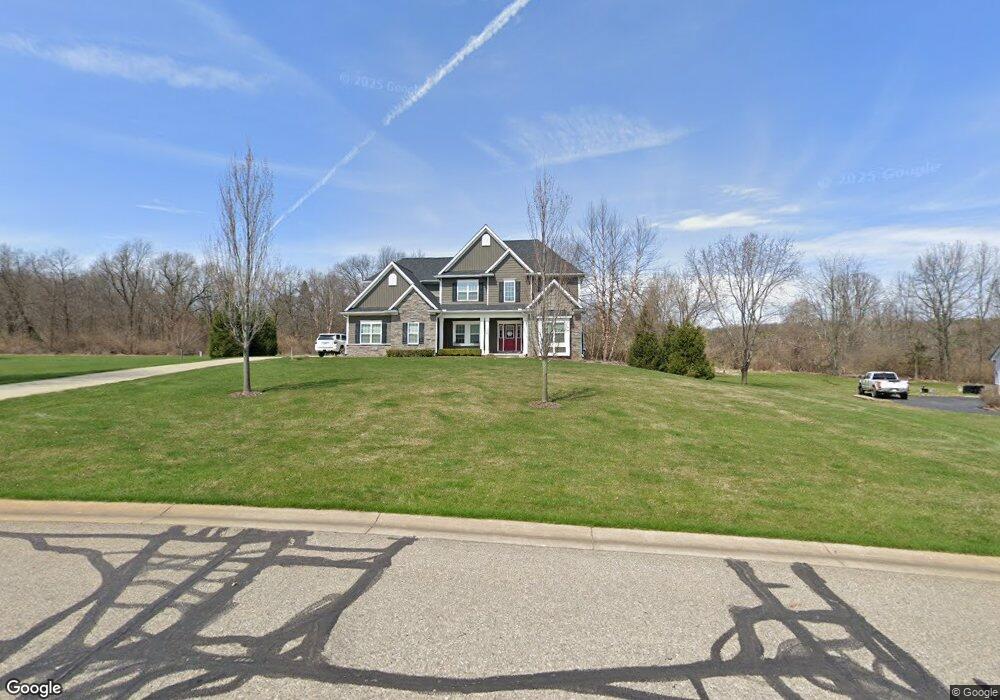
19 Abby Brook Ln Howell, MI 48843
Estimated Value: $611,512 - $653,000
4
Beds
2
Baths
2,555
Sq Ft
$247/Sq Ft
Est. Value
About This Home
This home is located at 19 Abby Brook Ln, Howell, MI 48843 and is currently estimated at $630,878, approximately $246 per square foot. 19 Abby Brook Ln is a home located in Livingston County with nearby schools including Parker Middle School and Howell High School.
Ownership History
Date
Name
Owned For
Owner Type
Purchase Details
Closed on
Aug 19, 2025
Sold by
Whicker Joel E and Brown Cynthia
Bought by
Stevens Ryan M and Stevens Kristin T
Current Estimated Value
Home Financials for this Owner
Home Financials are based on the most recent Mortgage that was taken out on this home.
Original Mortgage
$576,000
Outstanding Balance
$575,501
Interest Rate
6.72%
Mortgage Type
New Conventional
Estimated Equity
$55,377
Purchase Details
Closed on
Aug 8, 2018
Sold by
Whicker Joel
Bought by
Whicker Joel
Purchase Details
Closed on
Sep 15, 2017
Sold by
Mitch Harris Building Co
Bought by
Whicker Joel E
Home Financials for this Owner
Home Financials are based on the most recent Mortgage that was taken out on this home.
Original Mortgage
$390,510
Interest Rate
3.89%
Mortgage Type
New Conventional
Purchase Details
Closed on
Mar 22, 2016
Sold by
The Danick Corporation
Bought by
Mitch Harris Building Company Inc
Purchase Details
Closed on
Dec 31, 2011
Sold by
Ore Creek Development Corp
Bought by
Danick Corporation
Create a Home Valuation Report for This Property
The Home Valuation Report is an in-depth analysis detailing your home's value as well as a comparison with similar homes in the area
Home Values in the Area
Average Home Value in this Area
Purchase History
| Date | Buyer | Sale Price | Title Company |
|---|---|---|---|
| Stevens Ryan M | $640,000 | None Listed On Document | |
| Whicker Joel | -- | -- | |
| Whicker Joel E | $433,900 | -- | |
| Mitch Harris Building Company Inc | $40,000 | None Available | |
| Danick Corporation | -- | -- |
Source: Public Records
Mortgage History
| Date | Status | Borrower | Loan Amount |
|---|---|---|---|
| Open | Stevens Ryan M | $576,000 | |
| Previous Owner | Whicker Joel E | $390,510 |
Source: Public Records
Tax History
| Year | Tax Paid | Tax Assessment Tax Assessment Total Assessment is a certain percentage of the fair market value that is determined by local assessors to be the total taxable value of land and additions on the property. | Land | Improvement |
|---|---|---|---|---|
| 2025 | $3,387 | $259,900 | $0 | $0 |
| 2024 | $3,291 | $296,500 | $0 | $0 |
| 2023 | $3,143 | $246,300 | $0 | $0 |
| 2022 | $4,313 | $199,800 | $0 | $0 |
| 2021 | $4,313 | $199,800 | $0 | $0 |
| 2020 | $4,393 | $216,800 | $0 | $0 |
| 2019 | $4,331 | $201,600 | $0 | $0 |
| 2018 | $4,278 | $185,100 | $0 | $0 |
| 2017 | $5,238 | $126,300 | $0 | $0 |
| 2016 | $516 | $22,500 | $0 | $0 |
| 2014 | $613 | $15,000 | $0 | $0 |
| 2012 | $613 | $13,000 | $0 | $0 |
Source: Public Records
Map
Nearby Homes
- 5186 Pinckney Rd
- 0000 Brighton Rd
- 1 Brighton Rd
- 05 Prince Edward Dr
- 5150 Edward James Dr
- 4681 Roya Trail
- 2853 Rubbins Rd
- 2921 Clivedon Rd
- 2878 Clivedon Rd
- 4315 Gale Dr
- 2105 Webster Park Dr
- 2146 Webster Park Dr
- 3530 Kipling Cir
- 4539 Parker Dr
- 0 Pinckney Rd Unit 50200988
- Lot 1 Pinckney Rd
- 3760 Southwick Dr
- 1286 Gray Fox Ct
- 167 Forest Valley Ct
- Parcel 1 E Coon Lake Rd
- 359 Abby Brook Ln
- 341 Abby Brook Ln
- 377 Abby Brook Ln Unit 20
- 360 Abby Brook Ln
- 0 Pleasant Lake Rd
- 5295 Pleasant Lake Rd
- 323 Abby Brook Ln
- 17 Abby Brook Ln
- 21 Abby Brook Ln
- 395 Abby Brook Ln
- 5233 Pleasant Lake Rd
- 316 Abby Brook Ln
- 5252 Pleasant Lake Rd
- 5227 Pleasant Lake Rd
- 304 Abby Brook Ln
- 305 Abby Brook Ln
- 16 Abby Brook Ln
- 245 Oak Bark Dr
- 414 Abby Brook Ln
- 22 Abby Brook Ln
Your Personal Tour Guide
Ask me questions while you tour the home.