19 Algonquin Rd Medfield, MA 02052
Estimated Value: $1,265,000 - $1,361,000
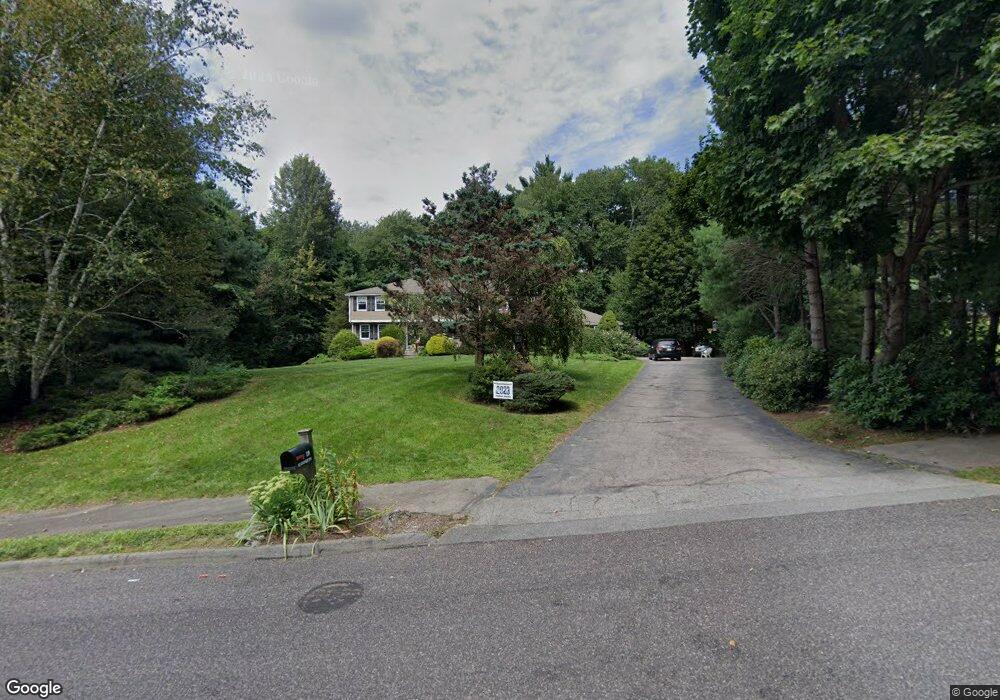
About This Home
This home is located at 19 Algonquin Rd, Medfield, MA 02052 and is currently estimated at $1,314,491, approximately $403 per square foot. 19 Algonquin Rd is a home located in Norfolk County with nearby schools including Ralph Wheelock School, Memorial School, and Dale Street School.
Ownership History
We collect this data history from publicly available records. To have your information removed, we recommend requesting removal directly through your county’s website.
Purchase Details
Purchase Details
Purchase Details
Home Values in the Area
Average Home Value in this Area
Purchase History
We collect this data history from publicly available records. To have your information removed, we recommend requesting removal directly through your county’s website.
| Date | Buyer | Sale Price | Title Company |
|---|---|---|---|
| -- | -- | ||
| $748,000 | -- | ||
| $748,000 | -- | ||
| $811,000 | -- | ||
| $811,000 | -- | ||
| $811,000 | -- |
Mortgage History
We collect this data history from publicly available records. To have your information removed, we recommend requesting removal directly through your county’s website.
| Date | Status | Borrower | Loan Amount |
|---|---|---|---|
| Previous Owner | $403,000 | ||
| Previous Owner | $408,000 |
Tax History
We collect this data history from publicly available records. To have your information removed, we recommend requesting removal directly through your county’s website.
| Year | Tax Paid | Tax Assessment Tax Assessment Total Assessment is a certain percentage of the fair market value that is determined by local assessors to be the total taxable value of land and additions on the property. | Land | Improvement |
|---|---|---|---|---|
| 2025 | $14,558 | $1,054,900 | $460,100 | $594,800 |
| 2024 | $14,350 | $980,200 | $420,100 | $560,100 |
| 2023 | $14,114 | $914,700 | $400,100 | $514,600 |
| 2022 | $13,382 | $768,200 | $380,100 | $388,100 |
| 2021 | $13,313 | $749,600 | $378,100 | $371,500 |
| 2020 | $13,128 | $736,300 | $376,100 | $360,200 |
| 2019 | $12,904 | $722,100 | $360,100 | $362,000 |
| 2018 | $11,781 | $691,800 | $335,300 | $356,500 |
| 2017 | $11,225 | $664,600 | $308,100 | $356,500 |
| 2016 | $11,099 | $662,600 | $306,100 | $356,500 |
| 2015 | $10,594 | $660,500 | $306,100 | $354,400 |
| 2014 | $9,841 | $610,500 | $256,100 | $354,400 |
Map
- 20 Applewood Rd
- 16 Day St
- 64 Village St
- 8 Castle Rd
- 189 1/2 Seekonk St
- 11 Holbrook St
- 5 Bayberry Cir
- 60 Hilltop Dr
- 186 Pleasant St
- 26 Fleetwood Dr
- 203 Pleasant St
- 13 Cleary Cir Unit 13
- 15 Cleary Cir Unit 15
- U18 Thomas Mann Cir Unit 18
- 27 Cleary Cir Unit 27
- 234-236-0 Pleasant St
- 10 Fleetwood Dr
- 488R Main St
- 1280 Main St
- 57 Thomas Mann Cir Unit 33
Ask me questions while you tour the home.