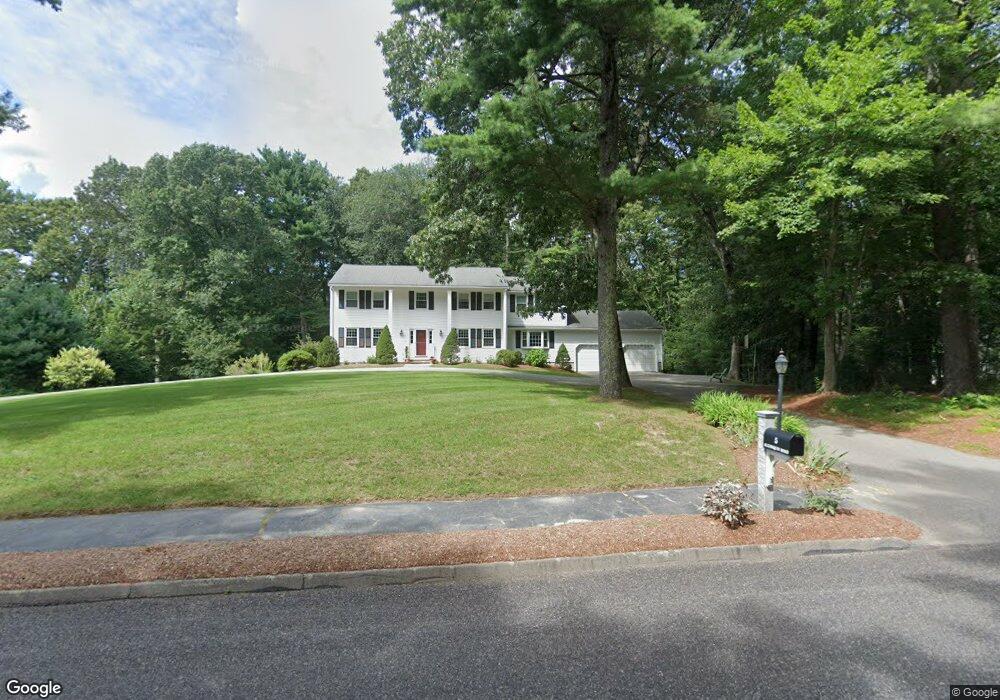
5 Algonquin Rd Medfield, MA 02052
Medfield AreaEstimated Value: $1,232,000 - $1,321,000
5
Beds
3
Baths
3,028
Sq Ft
$424/Sq Ft
Est. Value
About This Home
This home is located at 5 Algonquin Rd, Medfield, MA 02052 and is currently estimated at $1,283,112, approximately $423 per square foot. 5 Algonquin Rd is a home located in Norfolk County with nearby schools including Memorial School, Ralph Wheelock School, and Dale Street School.
Create a Home Valuation Report for This Property
The Home Valuation Report is an in-depth analysis detailing your home's value as well as a comparison with similar homes in the area
Home Values in the Area
Average Home Value in this Area
Tax History
We collect this data history from publicly available records. To have your information removed, we recommend requesting removal directly through your county’s website.
| Year | Tax Paid | Tax Assessment Tax Assessment Total Assessment is a certain percentage of the fair market value that is determined by local assessors to be the total taxable value of land and additions on the property. | Land | Improvement |
|---|---|---|---|---|
| 2025 | $14,861 | $1,076,900 | $460,200 | $616,700 |
| 2024 | $14,454 | $987,300 | $420,200 | $567,100 |
| 2023 | $14,194 | $919,900 | $400,200 | $519,700 |
| 2022 | $13,638 | $782,900 | $380,200 | $402,700 |
| 2021 | $13,531 | $761,900 | $378,200 | $383,700 |
| 2020 | $13,346 | $748,500 | $376,200 | $372,300 |
| 2019 | $13,115 | $733,900 | $360,200 | $373,700 |
| 2018 | $11,958 | $702,200 | $335,400 | $366,800 |
| 2017 | $11,401 | $675,000 | $308,200 | $366,800 |
| 2016 | $11,244 | $671,300 | $306,200 | $365,100 |
| 2015 | $10,708 | $667,600 | $306,200 | $361,400 |
| 2014 | $9,956 | $617,600 | $256,200 | $361,400 |
Source: Public Records
Map
Nearby Homes
- 31 Pennacook St
- 15 Applewood Rd
- 8 Chicatabut Ave
- 49 Noon Hill Ave
- 28 Heritage Path
- 353 Plain St
- 13 Meadowbrook Rd Unit 13
- 5 Bayberry Cir
- 15 Cleary Cir Unit 15
- 27 Cleary Cir Unit 27
- 702 Main St Unit E
- 57 Thomas Mann Cir Unit 33
- 30 Stanhope Dr
- 47 Thomas Mann Cir Unit 28
- 234-236-0 Pleasant St
- 37 Thomas Mann Cir Unit 23
- 27 Thomas Mann Cir Unit 18
- 488R Main St
- 1280 Main St
- 99 Boardman St
Your Personal Tour Guide
Ask me questions while you tour the home.