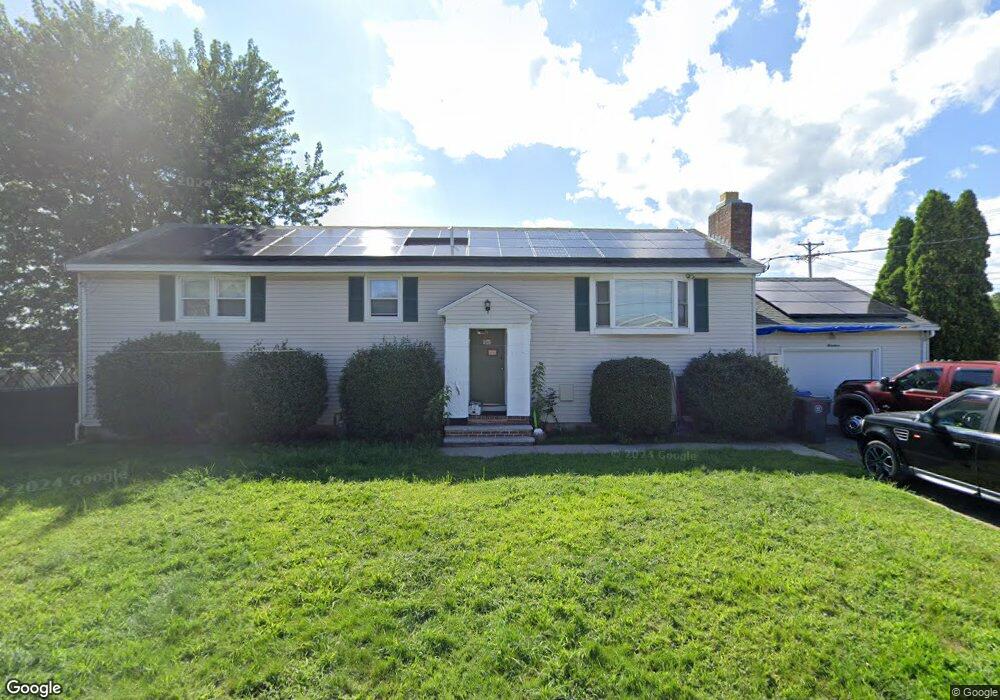
19 Allen St Methuen, MA 01844
The West End NeighborhoodEstimated Value: $661,000 - $704,000
3
Beds
3
Baths
2,664
Sq Ft
$254/Sq Ft
Est. Value
About This Home
This home is located at 19 Allen St, Methuen, MA 01844 and is currently estimated at $676,595, approximately $253 per square foot. 19 Allen St is a home located in Essex County with nearby schools including Marsh Grammar School, South Point Elementary School, and Methuen High School.
Ownership History
Date
Name
Owned For
Owner Type
Purchase Details
Closed on
Aug 25, 2006
Sold by
Quirion Benoit and Stlaurent Maria Pomerleau
Bought by
Dube Christine M and Dube Steven E
Current Estimated Value
Home Financials for this Owner
Home Financials are based on the most recent Mortgage that was taken out on this home.
Original Mortgage
$317,000
Interest Rate
6.83%
Mortgage Type
Purchase Money Mortgage
Purchase Details
Closed on
Oct 23, 1989
Sold by
Godin Paul
Bought by
Autieri Anna
Create a Home Valuation Report for This Property
The Home Valuation Report is an in-depth analysis detailing your home's value as well as a comparison with similar homes in the area
Home Values in the Area
Average Home Value in this Area
Purchase History
| Date | Buyer | Sale Price | Title Company |
|---|---|---|---|
| Dube Christine M | $350,000 | -- | |
| Dube Christine M | $350,000 | -- | |
| Autieri Anna | $170,000 | -- | |
| Autieri Anna | $170,000 | -- |
Source: Public Records
Mortgage History
| Date | Status | Borrower | Loan Amount |
|---|---|---|---|
| Open | Autieri Anna | $300,700 | |
| Closed | Dube Christine M | $317,000 |
Source: Public Records
Tax History Compared to Growth
Tax History
| Year | Tax Paid | Tax Assessment Tax Assessment Total Assessment is a certain percentage of the fair market value that is determined by local assessors to be the total taxable value of land and additions on the property. | Land | Improvement |
|---|---|---|---|---|
| 2025 | $6,006 | $567,700 | $217,200 | $350,500 |
| 2024 | $5,959 | $548,700 | $197,400 | $351,300 |
| 2023 | $5,652 | $483,100 | $174,600 | $308,500 |
| 2022 | $5,502 | $421,600 | $144,300 | $277,300 |
| 2021 | $5,255 | $398,400 | $136,700 | $261,700 |
| 2020 | $5,230 | $389,100 | $136,700 | $252,400 |
| 2019 | $5,036 | $354,900 | $129,100 | $225,800 |
| 2018 | $4,899 | $343,300 | $129,100 | $214,200 |
| 2017 | $4,644 | $317,000 | $121,500 | $195,500 |
| 2016 | $4,601 | $310,700 | $121,500 | $189,200 |
| 2015 | $4,380 | $300,000 | $113,900 | $186,100 |
Source: Public Records
Map
Nearby Homes
- 362 Lowell St
- 14 Youngfarm Rd
- 492 Lowell St
- 35 Memorial Dr
- 14 Tyler St
- 945 Riverside Dr Unit 2A
- 134 Haverhill St
- 2 Glen Forest Ln
- 38 Butternut Ln
- 32 Glen Ave
- 86 Butternut Ln
- 90 Butternut Ln
- 57 Strathmore Rd
- 2 Sugar Hill Cir
- 14-16 Cypress Ave
- 4 Capitol St
- 8 Francella Rd
- 37 Maplewood Ave
- 88-90 Columbus Ave
- 17-19 Maplewood Ave
- 23 Allen St
- 14 Allen St
- 16 Allen St
- 18 Allen St
- 1111 Riverside Dr Unit 7-8
- 1111 Riverside Dr Unit 1
- 1111 Riverside Dr
- 27 Allen St
- 9 Griffin St
- 11 Griffin St
- 31 Allen St
- 15 Griffin St
- 0 N Lowell St
- 17&19 Griffin Street Extension
- 26 Allen St
- 1101 Riverside Dr
- 17 Griffin St
- 447 Lowell St
- 14 N Lowell St
- 13 Bolduc St