Estimated Value: $1,494,000 - $1,780,351
4
Beds
4
Baths
3,164
Sq Ft
$539/Sq Ft
Est. Value
About This Home
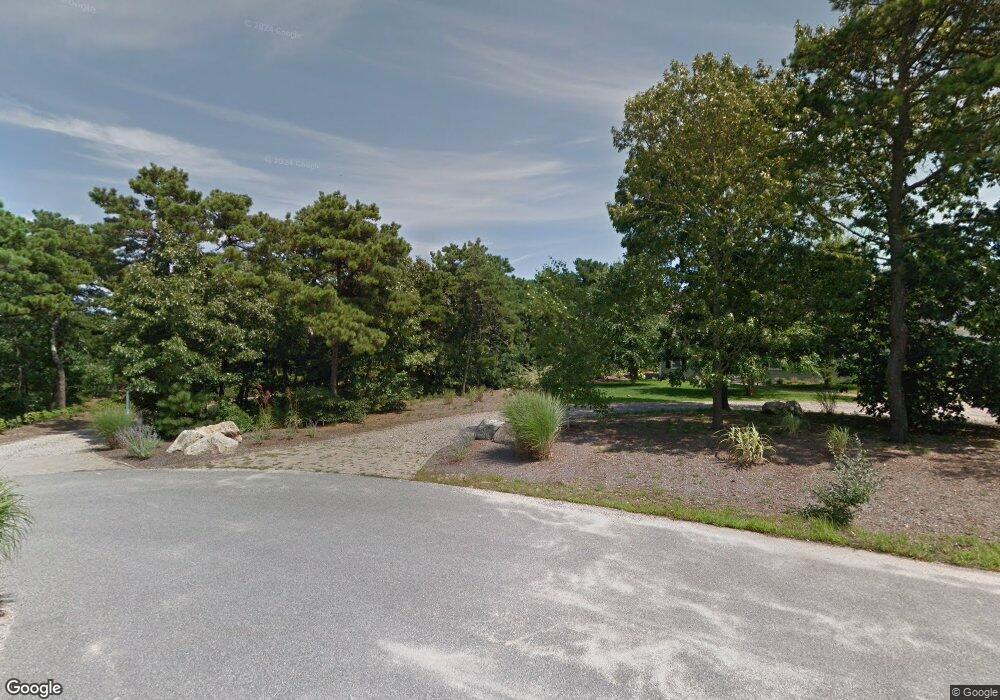
This home is located at 19 Andrew Way, Truro, MA 02666 and is currently estimated at $1,703,838, approximately $538 per square foot. 19 Andrew Way is a home located in Barnstable County.
Ownership History
Date
Name
Owned For
Owner Type
Purchase Details
Closed on
Feb 13, 2017
Sold by
Wood Richard B and Wood Beth N
Bought by
Beth N Wood 2016 Lt
Current Estimated Value
Purchase Details
Closed on
Jun 16, 2006
Sold by
Chariot Rt
Bought by
Wood Beth N and Wood Richard B
Home Financials for this Owner
Home Financials are based on the most recent Mortgage that was taken out on this home.
Original Mortgage
$650,000
Interest Rate
6.62%
Mortgage Type
Purchase Money Mortgage
Create a Home Valuation Report for This Property
The Home Valuation Report is an in-depth analysis detailing your home's value as well as a comparison with similar homes in the area
Home Values in the Area
Average Home Value in this Area
Purchase History
| Date | Buyer | Sale Price | Title Company |
|---|---|---|---|
| Beth N Wood 2016 Lt | -- | -- | |
| Wood Beth N | $980,000 | -- |
Source: Public Records
Mortgage History
| Date | Status | Borrower | Loan Amount |
|---|---|---|---|
| Previous Owner | Wood Beth N | $650,000 |
Source: Public Records
Tax History Compared to Growth
Tax History
| Year | Tax Paid | Tax Assessment Tax Assessment Total Assessment is a certain percentage of the fair market value that is determined by local assessors to be the total taxable value of land and additions on the property. | Land | Improvement |
|---|---|---|---|---|
| 2025 | $8,731 | $1,412,800 | $286,500 | $1,126,300 |
| 2024 | $8,207 | $1,370,200 | $283,600 | $1,086,600 |
| 2023 | $7,472 | $1,142,500 | $246,600 | $895,900 |
| 2022 | $6,846 | $885,700 | $212,600 | $673,100 |
| 2021 | $6,235 | $844,900 | $212,600 | $632,300 |
| 2020 | $4,218 | $841,700 | $210,500 | $631,200 |
| 2019 | $6,062 | $813,700 | $210,500 | $603,200 |
| 2018 | $5,542 | $751,900 | $210,500 | $541,400 |
| 2017 | $3,524 | $727,200 | $210,500 | $516,700 |
| 2016 | $4,880 | $720,800 | $208,400 | $512,400 |
| 2015 | $4,673 | $704,900 | $206,400 | $498,500 |
Source: Public Records
Map
Nearby Homes
- 2 Aldrich Rd
- 2 Amanda Ln
- 3 Perry Rd
- 5 Sylvan Ln
- 4 Resolution Rd
- 6 Long Nook Ln
- 7 Great Hollow Rd Unit 50
- 7 Great Hollow Rd Unit 50
- 25 Resolution Rd
- 9 Kinnikinnick Rd
- 3 Bayberry Rd
- 7 Fishermans Rd
- 27 Fishermans Rd
- 25 Noons Dr
- 52 Corn Hill Rd
- 18 Hopkins Way
- 4 S Highland Rd Unit C
- 23 Crestview Cir
- 14 N Union Field Rd
- 2 Meetinghouse Rd Unit 2