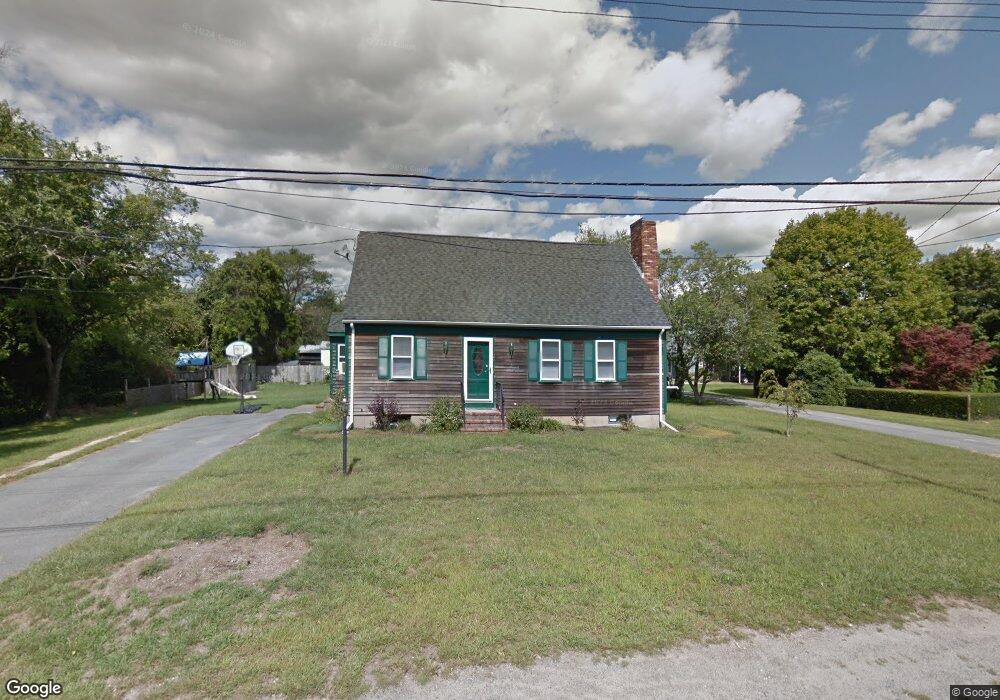
19 Anthony St Acushnet, MA 02743
North Fairhaven NeighborhoodEstimated Value: $467,000 - $529,000
3
Beds
2
Baths
2,153
Sq Ft
$227/Sq Ft
Est. Value
About This Home
This home is located at 19 Anthony St, Acushnet, MA 02743 and is currently estimated at $489,214, approximately $227 per square foot. 19 Anthony St is a home located in Bristol County with nearby schools including Acushnet Elementary School, Albert F Ford Middle School, and Alma Del Mar Charter School.
Ownership History
Date
Name
Owned For
Owner Type
Purchase Details
Closed on
Apr 26, 2007
Sold by
Parker Glen A and Medeiros Matthew J
Bought by
Galuski Catherine L and Galuski Michael J
Current Estimated Value
Home Financials for this Owner
Home Financials are based on the most recent Mortgage that was taken out on this home.
Original Mortgage
$228,750
Outstanding Balance
$139,217
Interest Rate
6.18%
Mortgage Type
Purchase Money Mortgage
Estimated Equity
$349,997
Purchase Details
Closed on
Dec 1, 2005
Sold by
Drolet Carl R
Bought by
Parker Glen A and Medeiros Matthew J
Purchase Details
Closed on
Feb 14, 1992
Sold by
Guay Ronald R and Guay Muriel E
Bought by
Drolet Carl R and Drolet Elizabeth M
Create a Home Valuation Report for This Property
The Home Valuation Report is an in-depth analysis detailing your home's value as well as a comparison with similar homes in the area
Home Values in the Area
Average Home Value in this Area
Purchase History
| Date | Buyer | Sale Price | Title Company |
|---|---|---|---|
| Galuski Catherine L | $305,000 | -- | |
| Parker Glen A | $280,000 | -- | |
| Drolet Carl R | $106,000 | -- |
Source: Public Records
Mortgage History
| Date | Status | Borrower | Loan Amount |
|---|---|---|---|
| Open | Drolet Carl R | $228,750 | |
| Closed | Drolet Carl R | $76,250 | |
| Previous Owner | Drolet Carl R | $258,750 |
Source: Public Records
Tax History
| Year | Tax Paid | Tax Assessment Tax Assessment Total Assessment is a certain percentage of the fair market value that is determined by local assessors to be the total taxable value of land and additions on the property. | Land | Improvement |
|---|---|---|---|---|
| 2025 | $42 | $389,600 | $95,100 | $294,500 |
| 2024 | $3,973 | $348,200 | $90,700 | $257,500 |
| 2023 | $4,025 | $335,400 | $81,900 | $253,500 |
| 2022 | $3,956 | $298,100 | $77,400 | $220,700 |
| 2021 | $2,638 | $251,300 | $77,400 | $173,900 |
| 2020 | $3,503 | $251,300 | $77,400 | $173,900 |
| 2019 | $3,244 | $228,800 | $68,600 | $160,200 |
| 2018 | $2,269 | $216,600 | $68,600 | $148,000 |
| 2017 | $3,012 | $208,600 | $68,600 | $140,000 |
| 2016 | $3,053 | $210,100 | $68,600 | $141,500 |
| 2015 | $2,780 | $194,700 | $68,600 | $126,100 |
Source: Public Records
Map
Nearby Homes
Your Personal Tour Guide
Ask me questions while you tour the home.