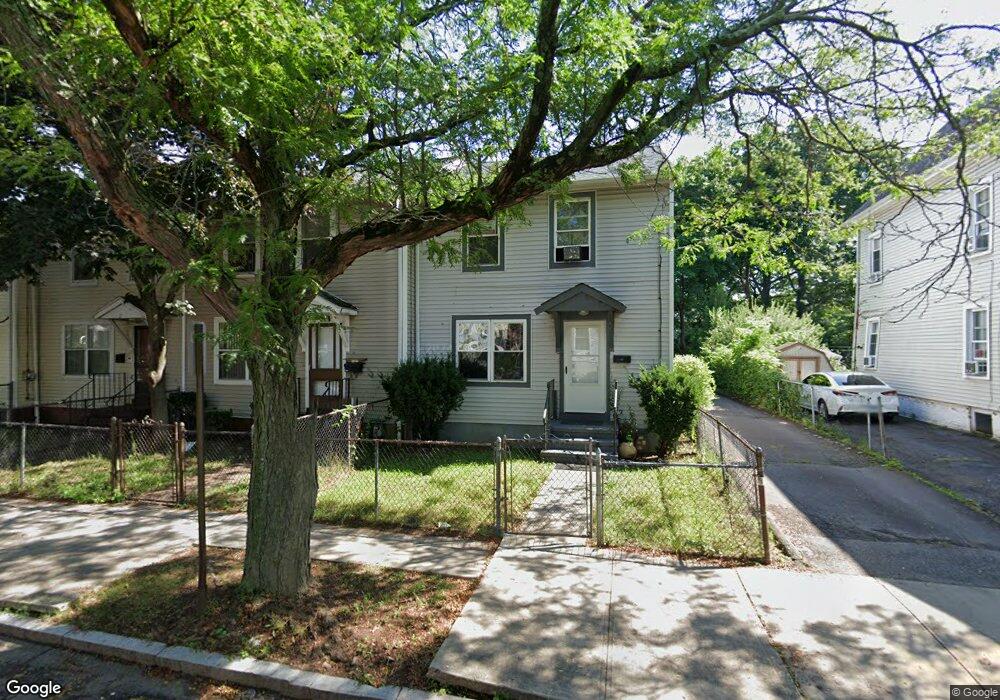
19 Arch St New Haven, CT 06519
The Hill NeighborhoodEstimated Value: $248,000 - $279,000
3
Beds
2
Baths
1,160
Sq Ft
$226/Sq Ft
Est. Value
About This Home
This home is located at 19 Arch St, New Haven, CT 06519 and is currently estimated at $261,960, approximately $225 per square foot. 19 Arch St is a home located in New Haven County with nearby schools including John C. Daniels and St Martin De Porres Academy.
Ownership History
Date
Name
Owned For
Owner Type
Purchase Details
Closed on
Jul 8, 2008
Sold by
M&I Dev Co
Bought by
George Vencentia
Current Estimated Value
Purchase Details
Closed on
Jul 3, 1991
Sold by
Kaplan Hermene
Bought by
Kaplan Hermene
Home Financials for this Owner
Home Financials are based on the most recent Mortgage that was taken out on this home.
Original Mortgage
$25,800
Interest Rate
9%
Mortgage Type
Purchase Money Mortgage
Purchase Details
Closed on
Nov 2, 1987
Sold by
Neighborhood Hsg In
Bought by
Alvarado Rafael
Home Financials for this Owner
Home Financials are based on the most recent Mortgage that was taken out on this home.
Original Mortgage
$57,600
Interest Rate
10.97%
Create a Home Valuation Report for This Property
The Home Valuation Report is an in-depth analysis detailing your home's value as well as a comparison with similar homes in the area
Home Values in the Area
Average Home Value in this Area
Purchase History
| Date | Buyer | Sale Price | Title Company |
|---|---|---|---|
| George Vencentia | $28,000 | -- | |
| Kaplan Hermene | $25,800 | -- | |
| Alvarado Rafael | $64,000 | -- |
Source: Public Records
Mortgage History
| Date | Status | Borrower | Loan Amount |
|---|---|---|---|
| Previous Owner | Alvarado Rafael | $25,800 | |
| Previous Owner | Alvarado Rafael | $57,600 |
Source: Public Records
Tax History
| Year | Tax Paid | Tax Assessment Tax Assessment Total Assessment is a certain percentage of the fair market value that is determined by local assessors to be the total taxable value of land and additions on the property. | Land | Improvement |
|---|---|---|---|---|
| 2025 | $5,152 | $130,760 | $35,910 | $94,850 |
| 2024 | $5,034 | $130,760 | $35,910 | $94,850 |
| 2023 | $4,864 | $130,760 | $35,910 | $94,850 |
| 2022 | $5,198 | $130,760 | $35,910 | $94,850 |
| 2021 | $3,922 | $89,390 | $31,570 | $57,820 |
| 2020 | $3,922 | $89,390 | $31,570 | $57,820 |
| 2019 | $3,842 | $89,390 | $31,570 | $57,820 |
| 2018 | $3,842 | $89,390 | $31,570 | $57,820 |
| 2017 | $3,458 | $89,390 | $31,570 | $57,820 |
| 2016 | $2,388 | $57,470 | $11,480 | $45,990 |
| 2015 | $2,388 | $57,470 | $11,480 | $45,990 |
| 2014 | $2,388 | $57,470 | $11,480 | $45,990 |
Source: Public Records
Map
Nearby Homes
Your Personal Tour Guide
Ask me questions while you tour the home.