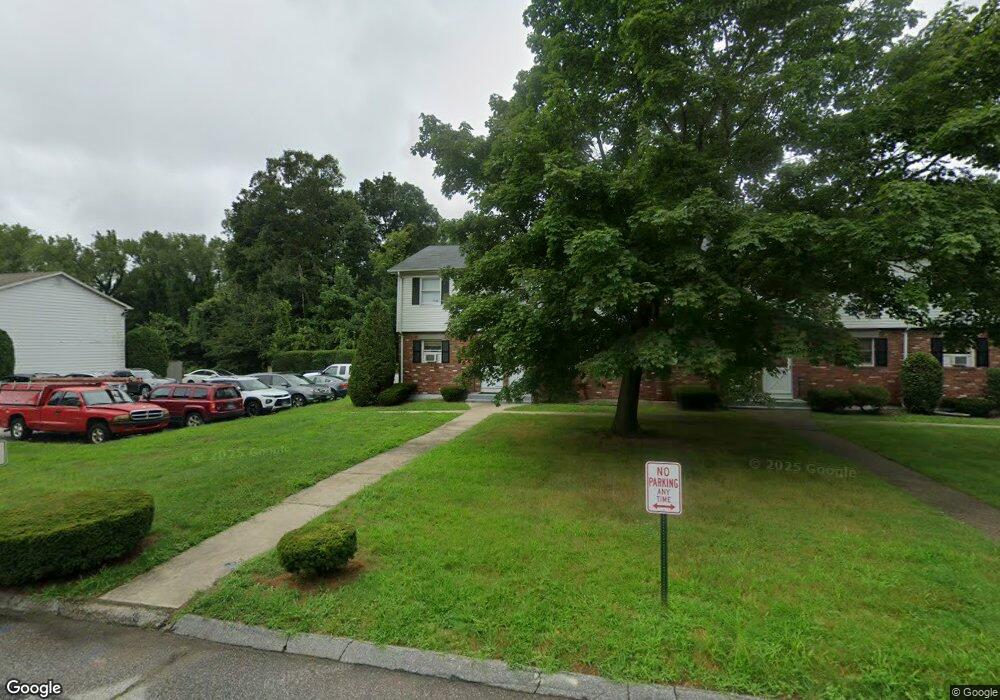
19 Athol St Danielson, CT 06239
Estimated Value: $182,000 - $219,000
2
Beds
2
Baths
896
Sq Ft
$223/Sq Ft
Est. Value
About This Home
This home is located at 19 Athol St, Danielson, CT 06239 and is currently estimated at $199,856, approximately $223 per square foot. 19 Athol St is a home located in Windham County with nearby schools including Killingly Central School, Killingly Memorial School, and Killingly Intermediate School.
Ownership History
Date
Name
Owned For
Owner Type
Purchase Details
Closed on
Jul 31, 2023
Sold by
Otajagic Merdan
Bought by
Otajagic Mersudin
Current Estimated Value
Purchase Details
Closed on
Jan 30, 2014
Sold by
Fhlmc
Bought by
Otajagic Merdan and Otajagic Mersudin
Purchase Details
Closed on
Jul 25, 2013
Sold by
Wells Fargo Bank Na
Bought by
Fhlmc
Purchase Details
Closed on
Aug 1, 2005
Sold by
Barden Gregory K and Barden Mary
Bought by
Bonisch Frank H
Home Financials for this Owner
Home Financials are based on the most recent Mortgage that was taken out on this home.
Original Mortgage
$115,000
Interest Rate
5.67%
Mortgage Type
Purchase Money Mortgage
Purchase Details
Closed on
Apr 25, 2000
Sold by
Keung Tam Hong
Bought by
Barden Gregory K and Bordieri Mary M
Purchase Details
Closed on
Jul 15, 1987
Sold by
Masso Richard
Bought by
Tam Hong
Create a Home Valuation Report for This Property
The Home Valuation Report is an in-depth analysis detailing your home's value as well as a comparison with similar homes in the area
Home Values in the Area
Average Home Value in this Area
Purchase History
| Date | Buyer | Sale Price | Title Company |
|---|---|---|---|
| Otajagic Mersudin | -- | None Available | |
| Otajagic Mersudin | -- | None Available | |
| Otajagic Merdan | $55,000 | -- | |
| Otajagic Merdan | $55,000 | -- | |
| Fhlmc | -- | -- | |
| Wells Fargo Bank Na | -- | -- | |
| Fhlmc | -- | -- | |
| Bonisch Frank H | $125,000 | -- | |
| Bonisch Frank H | $125,000 | -- | |
| Barden Gregory K | $115,000 | -- | |
| Barden Gregory K | $115,000 | -- | |
| Tam Hong | $67,500 | -- |
Source: Public Records
Mortgage History
| Date | Status | Borrower | Loan Amount |
|---|---|---|---|
| Previous Owner | Tam Hong | $115,000 |
Source: Public Records
Tax History Compared to Growth
Tax History
| Year | Tax Paid | Tax Assessment Tax Assessment Total Assessment is a certain percentage of the fair market value that is determined by local assessors to be the total taxable value of land and additions on the property. | Land | Improvement |
|---|---|---|---|---|
| 2025 | $2,655 | $106,000 | $0 | $106,000 |
| 2024 | $2,535 | $106,000 | $0 | $106,000 |
| 2023 | $1,817 | $56,630 | $0 | $56,630 |
| 2022 | $1,710 | $56,630 | $0 | $56,630 |
| 2021 | $1,710 | $56,630 | $0 | $56,630 |
| 2020 | $1,681 | $56,630 | $0 | $56,630 |
| 2019 | $1,699 | $56,630 | $0 | $56,630 |
| 2017 | $1,709 | $52,990 | $0 | $52,990 |
| 2016 | $1,673 | $51,870 | $0 | $51,870 |
| 2015 | $1,640 | $51,870 | $0 | $51,870 |
| 2014 | $1,601 | $51,870 | $0 | $51,870 |
Source: Public Records
Map
Nearby Homes