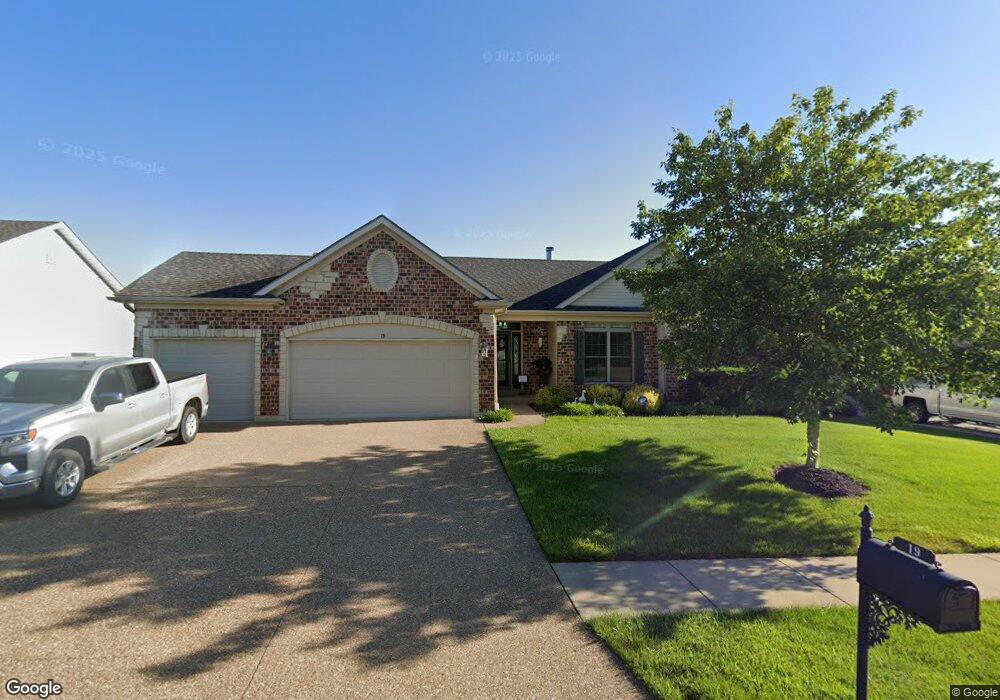
19 Austin Oaks Dr Moscow Mills, MO 63362
Estimated Value: $384,000 - $435,943
4
Beds
3
Baths
1,611
Sq Ft
$254/Sq Ft
Est. Value
About This Home
This home is located at 19 Austin Oaks Dr, Moscow Mills, MO 63362 and is currently estimated at $409,236, approximately $254 per square foot. 19 Austin Oaks Dr is a home located in Lincoln County with nearby schools including William R. Cappel Elementary School, Troy South Middle School, and Troy Buchanan High School.
Ownership History
Date
Name
Owned For
Owner Type
Purchase Details
Closed on
Feb 9, 2018
Sold by
Flannigan Patrick
Bought by
Flannigan Patrick and Flannigan Deborah Ann
Current Estimated Value
Home Financials for this Owner
Home Financials are based on the most recent Mortgage that was taken out on this home.
Original Mortgage
$204,500
Outstanding Balance
$173,019
Interest Rate
3.95%
Mortgage Type
New Conventional
Estimated Equity
$236,217
Purchase Details
Closed on
Nov 16, 2015
Sold by
Flannigan Patrick and Flannigan Deborah
Bought by
Flannigan Patrick and The Patrick Flannigan Revocable Trust
Purchase Details
Closed on
Dec 29, 2010
Sold by
Cms Homes Llc
Bought by
Flannigan Patrick and Flannigan Deborah
Home Financials for this Owner
Home Financials are based on the most recent Mortgage that was taken out on this home.
Original Mortgage
$191,600
Interest Rate
4.41%
Mortgage Type
New Conventional
Create a Home Valuation Report for This Property
The Home Valuation Report is an in-depth analysis detailing your home's value as well as a comparison with similar homes in the area
Home Values in the Area
Average Home Value in this Area
Purchase History
| Date | Buyer | Sale Price | Title Company |
|---|---|---|---|
| Flannigan Patrick | -- | None Available | |
| Flannigan Patrick | -- | None Available | |
| Flannigan Patrick | -- | None Available |
Source: Public Records
Mortgage History
| Date | Status | Borrower | Loan Amount |
|---|---|---|---|
| Open | Flannigan Patrick | $204,500 | |
| Closed | Flannigan Patrick | $191,600 |
Source: Public Records
Tax History Compared to Growth
Tax History
| Year | Tax Paid | Tax Assessment Tax Assessment Total Assessment is a certain percentage of the fair market value that is determined by local assessors to be the total taxable value of land and additions on the property. | Land | Improvement |
|---|---|---|---|---|
| 2025 | $3,732 | $55,544 | $5,715 | $49,829 |
| 2024 | $3,732 | $53,954 | $5,715 | $48,239 |
| 2023 | $3,713 | $53,954 | $5,715 | $48,239 |
| 2022 | $3,574 | $51,691 | $5,715 | $45,976 |
| 2021 | $3,591 | $272,060 | $0 | $0 |
| 2020 | $3,199 | $239,810 | $0 | $0 |
| 2019 | $3,202 | $239,810 | $0 | $0 |
| 2018 | $2,922 | $41,135 | $0 | $0 |
| 2017 | $2,930 | $41,135 | $0 | $0 |
| 2016 | $2,424 | $33,144 | $0 | $0 |
| 2015 | $2,427 | $33,144 | $0 | $0 |
| 2014 | $2,442 | $33,280 | $0 | $0 |
| 2013 | -- | $33,191 | $0 | $0 |
Source: Public Records
Map
Nearby Homes
- 136 Hayfield Dr
- 222 Austin Oaks Dr
- 432 Highway Mm
- 56 Grazing Way
- 121 Grindstone Ct
- 323 Laredo Ln
- 118 Grindstone Ct
- 167 Austin Oaks Dr
- 522 Amarillo Blvd
- 278 Railroad St
- 276 Railroad St
- 604 State Hwy Mm (3 5+ - Acres)
- 0 Hampel Rd
- 191 Gracie Ln
- 192 Hadley Grove Dr
- 634 Highway Mm
- 616 Schapers Ct
- 518 Clark's Crossing
- 21 Eldorado Dr
- 4367 Hwy C
- 15 Austin Oaks Dr
- 140 Hayfield Dr
- 258 Austin Oaks Dr
- 24 Austin Oaks Dr
- 24 Austin Oaks Dr
- 20 Austin Oaks Dr
- 144 Hayfield Dr
- 16 Austin Oaks Dr
- 254 Austin Oaks Dr
- 253 Austin Oaks Dr
- 132 Hayfield Dr
- 253 Austin Oaks Dr
- 1 San Antonio Ct
- 250 Austin Oaks Dr
- 250 Austin Oaks Dr
- 5 San Antonio Ct
- 133 Hayfield Dr
- 249 Austin Oaks Dr
- 0TBB Austin Oaks Dr
- 0TBB Austin Oaks Dr