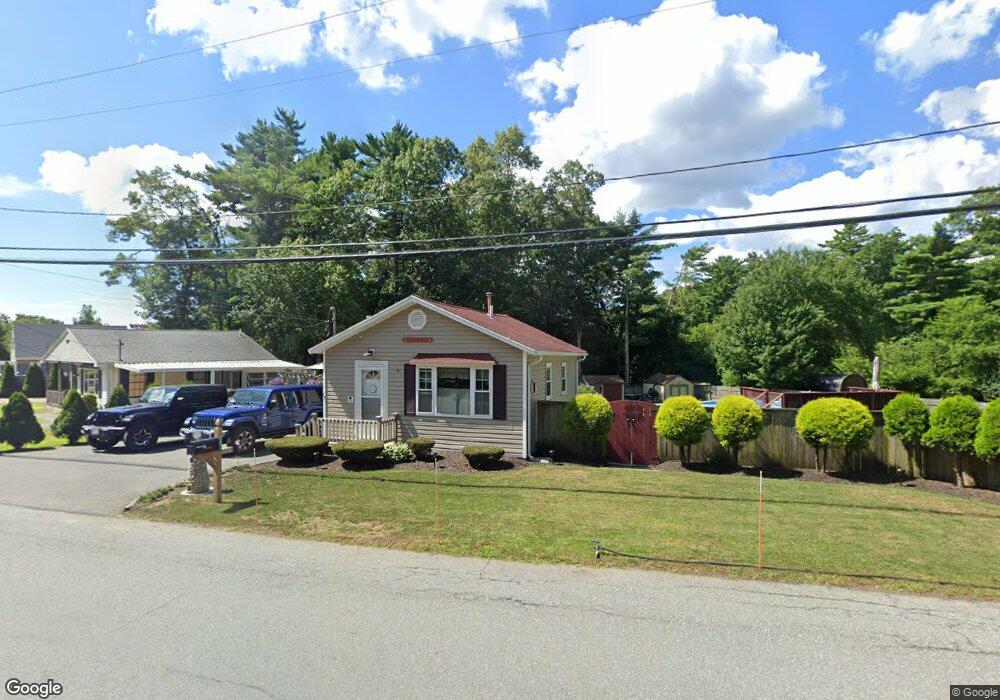
19 Barlow Ave West Wareham, MA 02576
Estimated Value: $368,560 - $405,000
2
Beds
1
Bath
780
Sq Ft
$498/Sq Ft
Est. Value
About This Home
This home is located at 19 Barlow Ave, West Wareham, MA 02576 and is currently estimated at $388,390, approximately $497 per square foot. 19 Barlow Ave is a home located in Plymouth County.
Ownership History
Date
Name
Owned For
Owner Type
Purchase Details
Closed on
Sep 3, 2021
Sold by
Braga Debra A
Bought by
Braga Herbert and Braga Debra A
Current Estimated Value
Home Financials for this Owner
Home Financials are based on the most recent Mortgage that was taken out on this home.
Original Mortgage
$230,000
Outstanding Balance
$207,450
Interest Rate
2.8%
Mortgage Type
New Conventional
Estimated Equity
$180,940
Purchase Details
Closed on
Dec 16, 2011
Sold by
Goncalves Donald R
Bought by
Braga Debra A
Home Financials for this Owner
Home Financials are based on the most recent Mortgage that was taken out on this home.
Original Mortgage
$153,896
Interest Rate
4.01%
Mortgage Type
Purchase Money Mortgage
Purchase Details
Closed on
Jul 9, 2010
Sold by
Kaspar Paul F and Gateway Home Improv In
Bought by
Goncalves Donald R
Create a Home Valuation Report for This Property
The Home Valuation Report is an in-depth analysis detailing your home's value as well as a comparison with similar homes in the area
Purchase History
| Date | Buyer | Sale Price | Title Company |
|---|---|---|---|
| Braga Herbert | -- | None Available | |
| Braga Herbert | -- | None Available | |
| Braga Herbert | -- | None Available | |
| Braga Debra A | $157,900 | -- | |
| Braga Debra A | $157,900 | -- | |
| Goncalves Donald R | $66,000 | -- | |
| Goncalves Donald R | $66,000 | -- | |
| Braga Debra A | $157,900 | -- | |
| Goncalves Donald R | $66,000 | -- |
Source: Public Records
Mortgage History
| Date | Status | Borrower | Loan Amount |
|---|---|---|---|
| Open | Braga Herbert | $230,000 | |
| Closed | Braga Herbert | $230,000 | |
| Previous Owner | Braga Debra A | $153,896 |
Source: Public Records
Tax History
| Year | Tax Paid | Tax Assessment Tax Assessment Total Assessment is a certain percentage of the fair market value that is determined by local assessors to be the total taxable value of land and additions on the property. | Land | Improvement |
|---|---|---|---|---|
| 2025 | $3,265 | $313,300 | $93,700 | $219,600 |
| 2024 | $3,416 | $304,200 | $71,600 | $232,600 |
| 2023 | $2,913 | $269,700 | $65,100 | $204,600 |
| 2022 | $2,913 | $221,000 | $65,100 | $155,900 |
| 2021 | $2,678 | $199,100 | $65,100 | $134,000 |
| 2020 | $2,526 | $190,500 | $65,100 | $125,400 |
| 2019 | $890 | $173,800 | $58,700 | $115,100 |
| 2018 | $2,229 | $163,500 | $58,700 | $104,800 |
| 2017 | $2,052 | $152,600 | $58,700 | $93,900 |
| 2016 | $1,822 | $134,700 | $53,900 | $80,800 |
| 2015 | $1,761 | $134,700 | $53,900 | $80,800 |
| 2014 | $1,713 | $133,300 | $50,500 | $82,800 |
Source: Public Records
Map
Nearby Homes
- 14 Briarwood Dr
- 12 Taft St
- 15 14th Ave
- 9 Woodville Way
- 4 Roosevelt St
- 929 Point Rd
- 233 Marion Rd
- 119 County Rd
- 127 County Rd
- 0 Cromesett Rd (Off) Unit 73385395
- 58 Shady Ln
- 245 Wareham Rd
- 4 Mather Dr
- 4 Blackhall Ct
- 6 Bourne Terrace
- 10 Longmeadow Dr
- 21 Bayview St
- 19 Station St
- 10 Barnes St
- 6 Wildwood Ave
Your Personal Tour Guide
Ask me questions while you tour the home.