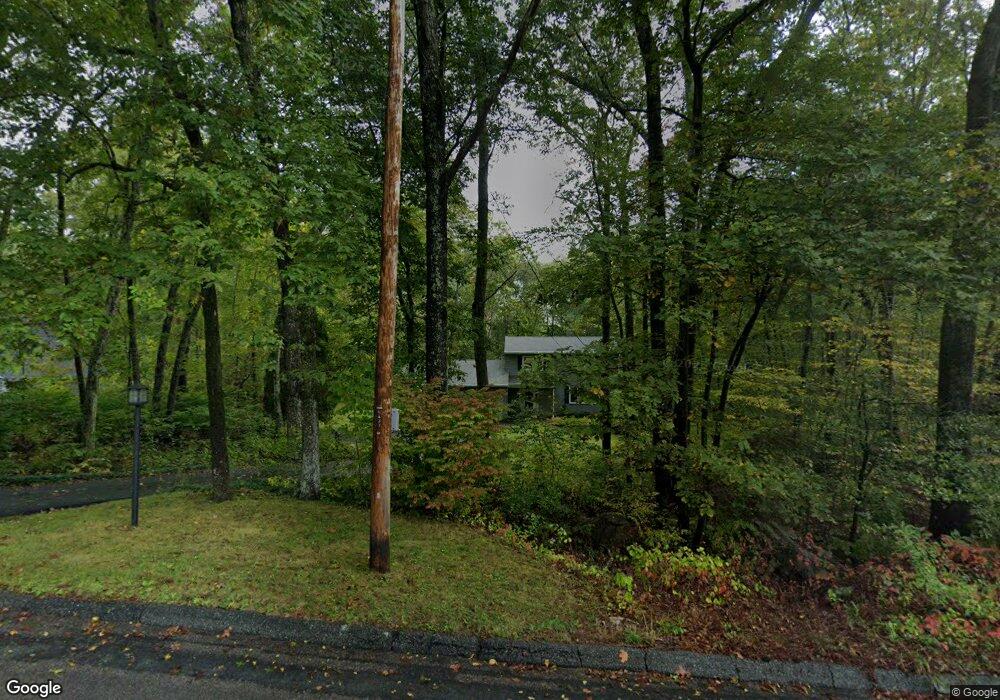
19 Barton Ln Ledyard, CT 06339
Estimated Value: $479,799 - $610,000
4
Beds
3
Baths
2,102
Sq Ft
$261/Sq Ft
Est. Value
About This Home
This home is located at 19 Barton Ln, Ledyard, CT 06339 and is currently estimated at $548,950, approximately $261 per square foot. 19 Barton Ln is a home located in New London County with nearby schools including Ledyard Middle School and Ledyard High School.
Ownership History
Date
Name
Owned For
Owner Type
Purchase Details
Closed on
Jan 18, 2018
Sold by
Nelson Carolyn A
Bought by
Nelson Carolyn A and Nelson Richard G
Current Estimated Value
Purchase Details
Closed on
Apr 24, 1998
Sold by
Giago Francesco and Rohrlick Eileen B
Bought by
Nelson Richard G and Nelson Carolyn A
Home Financials for this Owner
Home Financials are based on the most recent Mortgage that was taken out on this home.
Original Mortgage
$162,500
Interest Rate
7.11%
Mortgage Type
Unknown
Purchase Details
Closed on
Dec 16, 1994
Sold by
Zeller Randel Leonard
Bought by
Giaco Francisco and Giaco Eilleen Br
Home Financials for this Owner
Home Financials are based on the most recent Mortgage that was taken out on this home.
Original Mortgage
$167,850
Interest Rate
4.25%
Mortgage Type
Unknown
Purchase Details
Closed on
Nov 23, 1987
Sold by
Lenci Mark
Bought by
Zeller Randel
Home Financials for this Owner
Home Financials are based on the most recent Mortgage that was taken out on this home.
Original Mortgage
$161,250
Interest Rate
11.22%
Create a Home Valuation Report for This Property
The Home Valuation Report is an in-depth analysis detailing your home's value as well as a comparison with similar homes in the area
Home Values in the Area
Average Home Value in this Area
Purchase History
| Date | Buyer | Sale Price | Title Company |
|---|---|---|---|
| Nelson Carolyn A | -- | -- | |
| Nelson Richard G | $191,500 | -- | |
| Giaco Francisco | $186,500 | -- | |
| Zeller Randel | $215,000 | -- |
Source: Public Records
Mortgage History
| Date | Status | Borrower | Loan Amount |
|---|---|---|---|
| Previous Owner | Zeller Randel | $153,991 | |
| Previous Owner | Zeller Randel | $162,500 | |
| Previous Owner | Zeller Randel | $167,850 | |
| Previous Owner | Zeller Randel | $161,250 |
Source: Public Records
Tax History
| Year | Tax Paid | Tax Assessment Tax Assessment Total Assessment is a certain percentage of the fair market value that is determined by local assessors to be the total taxable value of land and additions on the property. | Land | Improvement |
|---|---|---|---|---|
| 2025 | $7,503 | $202,020 | $54,950 | $147,070 |
| 2024 | $7,113 | $202,020 | $54,950 | $147,070 |
| 2023 | $6,982 | $202,020 | $54,950 | $147,070 |
| 2022 | $6,832 | $202,020 | $54,950 | $147,070 |
| 2021 | $6,788 | $202,020 | $54,950 | $147,070 |
| 2020 | $6,095 | $174,300 | $59,990 | $114,310 |
| 2019 | $6,111 | $174,300 | $59,990 | $114,310 |
| 2018 | $5,977 | $174,300 | $59,990 | $114,310 |
| 2017 | $5,672 | $174,300 | $59,990 | $114,310 |
| 2016 | $5,560 | $174,300 | $59,990 | $114,310 |
| 2015 | $5,299 | $174,300 | $59,990 | $114,310 |
| 2014 | $5,392 | $180,320 | $59,990 | $120,330 |
Source: Public Records
Map
Nearby Homes
- 1661 Center Groton Rd
- 1541 North Rd
- 254 Haley Rd
- 186 Haley Rd
- 419 Colonel Ledyard Hwy
- 1459 Gold Star Hwy
- 459 Colonel Ledyard Hwy
- 1211 Gold Star Hwy
- 497 Colonel Ledyard Hwy
- 59 Pheasant Run Dr
- 70 Partridge Hollow Rd
- 25 Marty's Way
- 1 Marcel Rd
- 18 Marty's Way
- 98 Oslo St
- 669 Colonel Ledyard Hwy
- 16 Marty's Way
- 944 Long Cove Rd Unit 1
- 1010 Long Cove Rd Unit LOT 23
- 1010 Long Cove Rd Unit LOT 17
- 21 Barton Ln
- 17 Barton Ln
- 18 Barton Ln
- 30 Chriswood Trace
- 16 Barton Ln
- 15 Barton Ln
- 32 Chriswood Trace
- 25 Barton Ln
- 22 Barton Ln
- 14 Barton Ln
- 26 Chriswood Trace
- 28 Chriswood Trace
- 33 Chriswood Trace
- 34 Chriswood Trace
- 11 Barton Ln
- 34 Barton Ln
- 29 Chriswood Trace
- 10 Barton Ln
- 31 Chriswood Trace
- 36 Chriswood Trace
Your Personal Tour Guide
Ask me questions while you tour the home.