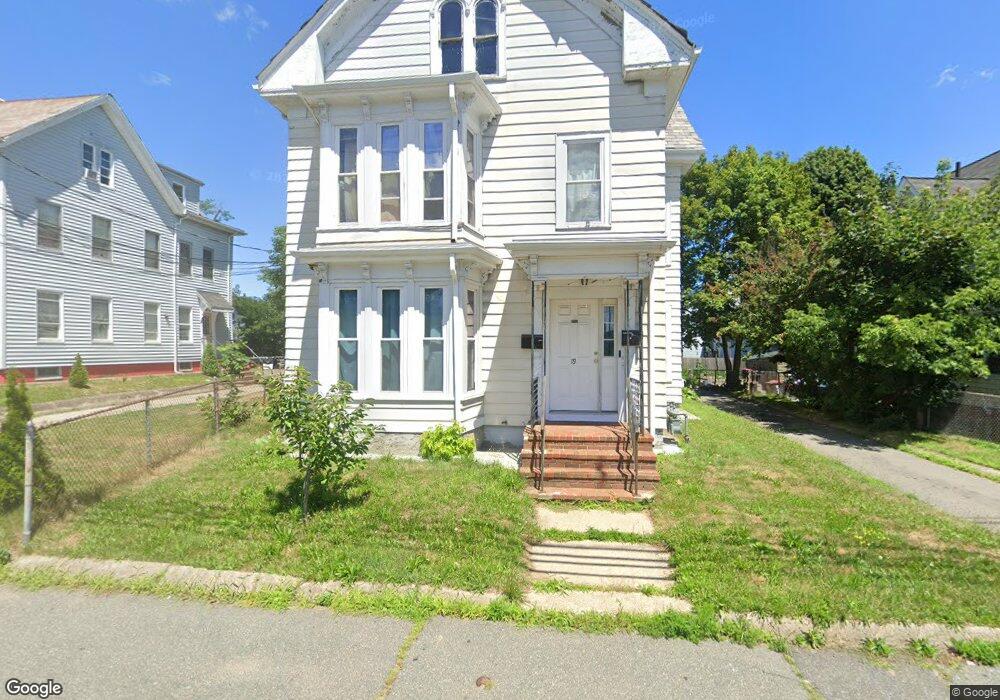
19 Battles St Brockton, MA 02301
Estimated Value: $564,000 - $801,000
4
Beds
2
Baths
2,374
Sq Ft
$286/Sq Ft
Est. Value
About This Home
This home is located at 19 Battles St, Brockton, MA 02301 and is currently estimated at $679,635, approximately $286 per square foot. 19 Battles St is a home located in Plymouth County with nearby schools including Louis F Angelo Elementary School, Raymond K-8 Elementary School, and Manthala George Jr. School.
Ownership History
Date
Name
Owned For
Owner Type
Purchase Details
Closed on
Oct 3, 2003
Sold by
Stanton Carol M
Bought by
Goncalves Miguel F and Goncalves Ana L
Current Estimated Value
Home Financials for this Owner
Home Financials are based on the most recent Mortgage that was taken out on this home.
Original Mortgage
$251,060
Outstanding Balance
$117,481
Interest Rate
6.25%
Mortgage Type
Purchase Money Mortgage
Estimated Equity
$562,154
Create a Home Valuation Report for This Property
The Home Valuation Report is an in-depth analysis detailing your home's value as well as a comparison with similar homes in the area
Home Values in the Area
Average Home Value in this Area
Purchase History
| Date | Buyer | Sale Price | Title Company |
|---|---|---|---|
| Goncalves Miguel F | $255,500 | -- |
Source: Public Records
Mortgage History
| Date | Status | Borrower | Loan Amount |
|---|---|---|---|
| Open | Goncalves Miguel F | $33,400 | |
| Closed | Goncalves Miguel F | $24,700 | |
| Open | Goncalves Miguel F | $251,060 |
Source: Public Records
Tax History Compared to Growth
Tax History
| Year | Tax Paid | Tax Assessment Tax Assessment Total Assessment is a certain percentage of the fair market value that is determined by local assessors to be the total taxable value of land and additions on the property. | Land | Improvement |
|---|---|---|---|---|
| 2025 | $7,165 | $591,700 | $140,300 | $451,400 |
| 2024 | $6,732 | $560,100 | $140,300 | $419,800 |
| 2023 | $6,534 | $503,400 | $105,300 | $398,100 |
| 2022 | $6,442 | $461,100 | $95,700 | $365,400 |
| 2021 | $5,822 | $401,500 | $79,700 | $321,800 |
| 2020 | $4,948 | $326,600 | $74,400 | $252,200 |
| 2019 | $5,153 | $331,600 | $72,600 | $259,000 |
| 2018 | $4,842 | $301,500 | $72,600 | $228,900 |
| 2017 | $4,403 | $273,500 | $72,600 | $200,900 |
| 2016 | $3,960 | $228,100 | $70,400 | $157,700 |
| 2015 | $3,561 | $196,200 | $70,400 | $125,800 |
| 2014 | $3,463 | $191,000 | $70,400 | $120,600 |
Source: Public Records
Map
Nearby Homes