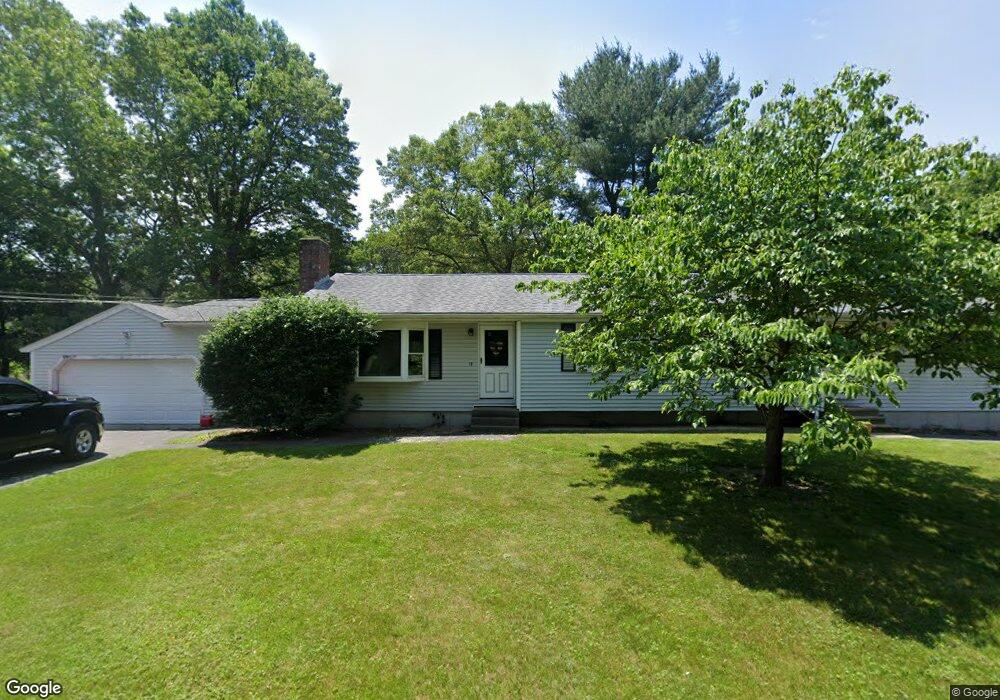
19 Belcher Ct Foxboro, MA 02035
Estimated Value: $656,000 - $835,000
3
Beds
2
Baths
1,900
Sq Ft
$372/Sq Ft
Est. Value
About This Home
This home is located at 19 Belcher Ct, Foxboro, MA 02035 and is currently estimated at $706,042, approximately $371 per square foot. 19 Belcher Ct is a home located in Norfolk County with nearby schools including Foxborough High School, Foxborough Regional Charter School, and Hands-On-Montessori School.
Ownership History
Date
Name
Owned For
Owner Type
Purchase Details
Closed on
Nov 2, 2009
Sold by
Sera James J and Sera Florence
Bought by
Bois Michael W
Current Estimated Value
Home Financials for this Owner
Home Financials are based on the most recent Mortgage that was taken out on this home.
Original Mortgage
$270,750
Outstanding Balance
$177,331
Interest Rate
5.06%
Mortgage Type
Purchase Money Mortgage
Estimated Equity
$528,711
Create a Home Valuation Report for This Property
The Home Valuation Report is an in-depth analysis detailing your home's value as well as a comparison with similar homes in the area
Home Values in the Area
Average Home Value in this Area
Purchase History
| Date | Buyer | Sale Price | Title Company |
|---|---|---|---|
| Bois Michael W | $285,000 | -- |
Source: Public Records
Mortgage History
| Date | Status | Borrower | Loan Amount |
|---|---|---|---|
| Open | Bois Michael W | $270,750 |
Source: Public Records
Tax History Compared to Growth
Tax History
| Year | Tax Paid | Tax Assessment Tax Assessment Total Assessment is a certain percentage of the fair market value that is determined by local assessors to be the total taxable value of land and additions on the property. | Land | Improvement |
|---|---|---|---|---|
| 2025 | $6,769 | $512,000 | $201,400 | $310,600 |
| 2024 | $7,156 | $529,700 | $217,000 | $312,700 |
| 2023 | $6,925 | $487,300 | $206,600 | $280,700 |
| 2022 | $5,940 | $409,100 | $185,200 | $223,900 |
| 2021 | $242 | $362,700 | $175,900 | $186,800 |
| 2020 | $5,285 | $362,700 | $175,900 | $186,800 |
| 2019 | $243 | $363,200 | $176,400 | $186,800 |
| 2018 | $4,625 | $317,400 | $167,600 | $149,800 |
| 2017 | $4,733 | $314,700 | $164,900 | $149,800 |
| 2016 | $4,707 | $317,600 | $158,700 | $158,900 |
| 2015 | $4,401 | $289,700 | $118,300 | $171,400 |
| 2014 | $4,230 | $282,200 | $118,300 | $163,900 |
Source: Public Records
Map
Nearby Homes
- 356 Central St
- 619 N Main St
- 44 Angell St Unit 44
- 28 Angell St
- 12 Spring St
- 277 Central St
- 166 Chauncy St
- 22 Pleasant St Unit C
- 82 Brook St
- 28 Court St
- 16 East St Unit 2
- 450 West St
- 11 W Belcher Rd Unit 2
- 409 Pratt St
- 18 Winter St Unit E
- 231 Spring St
- 14 Winter St Unit B
- 261 East St
- 84 Cocasset St Unit A6
- 1 Revere Dr