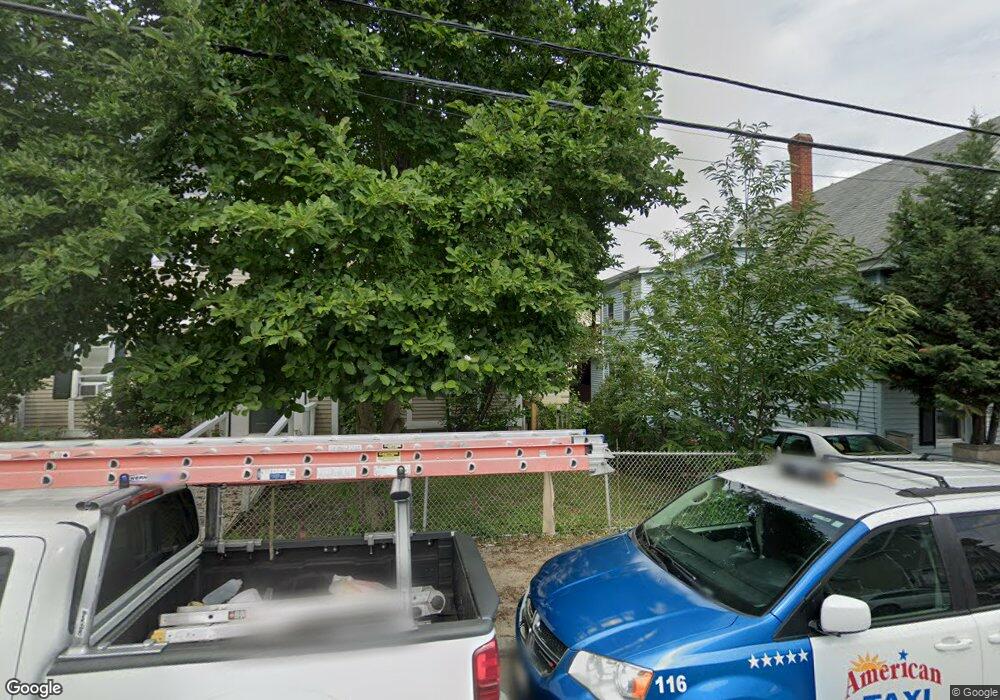
19 Berkeley St Lawrence, MA 01841
Prospect Hill-Back Bay NeighborhoodEstimated Value: $575,000 - $790,000
2
Beds
1
Bath
952
Sq Ft
$704/Sq Ft
Est. Value
About This Home
This home is located at 19 Berkeley St, Lawrence, MA 01841 and is currently estimated at $670,632, approximately $704 per square foot. 19 Berkeley St is a home located in Essex County with nearby schools including School For Exceptional Studies, Community Day Charter Public School - Gateway, and Esperanza Academy School of Hope.
Ownership History
Date
Name
Owned For
Owner Type
Purchase Details
Closed on
Jan 10, 2011
Sold by
Ian Nt and Sabatino
Bought by
Denise Realty Llc
Current Estimated Value
Purchase Details
Closed on
Dec 8, 2008
Sold by
Quiroz Julio and Us Bk
Bought by
Ian Nt and Sabatino Tr
Purchase Details
Closed on
Dec 12, 2003
Sold by
Ventura Jose G
Bought by
Quiroz Julio
Home Financials for this Owner
Home Financials are based on the most recent Mortgage that was taken out on this home.
Original Mortgage
$189,000
Interest Rate
5.9%
Mortgage Type
Purchase Money Mortgage
Purchase Details
Closed on
Oct 20, 2000
Sold by
Department Of Housing & Urban Dev
Bought by
Ventura Jose G
Home Financials for this Owner
Home Financials are based on the most recent Mortgage that was taken out on this home.
Original Mortgage
$89,300
Interest Rate
7.88%
Mortgage Type
Purchase Money Mortgage
Purchase Details
Closed on
Jan 5, 1988
Sold by
Mallett Antoinette
Bought by
Gallo Ralph R
Create a Home Valuation Report for This Property
The Home Valuation Report is an in-depth analysis detailing your home's value as well as a comparison with similar homes in the area
Home Values in the Area
Average Home Value in this Area
Purchase History
| Date | Buyer | Sale Price | Title Company |
|---|---|---|---|
| Denise Realty Llc | -- | -- | |
| Ian Nt | $69,100 | -- | |
| Quiroz Julio | $210,000 | -- | |
| Ventura Jose G | $94,000 | -- | |
| Gallo Ralph R | $100,000 | -- |
Source: Public Records
Mortgage History
| Date | Status | Borrower | Loan Amount |
|---|---|---|---|
| Previous Owner | Quiroz Julio | $189,000 | |
| Previous Owner | Gallo Ralph R | $150,000 | |
| Previous Owner | Gallo Ralph R | $112,500 | |
| Previous Owner | Gallo Ralph R | $89,300 |
Source: Public Records
Tax History
| Year | Tax Paid | Tax Assessment Tax Assessment Total Assessment is a certain percentage of the fair market value that is determined by local assessors to be the total taxable value of land and additions on the property. | Land | Improvement |
|---|---|---|---|---|
| 2025 | $4,917 | $558,800 | $115,300 | $443,500 |
| 2024 | $4,723 | $510,600 | $121,200 | $389,400 |
| 2023 | $4,900 | $482,300 | $117,000 | $365,300 |
| 2022 | $4,717 | $412,300 | $110,300 | $302,000 |
| 2021 | $4,626 | $377,000 | $110,300 | $266,700 |
| 2020 | $4,060 | $326,600 | $91,900 | $234,700 |
| 2019 | $3,891 | $284,400 | $68,300 | $216,100 |
| 2018 | $3,740 | $261,200 | $61,900 | $199,300 |
| 2017 | $3,390 | $221,000 | $58,700 | $162,300 |
| 2016 | $3,166 | $204,100 | $45,800 | $158,300 |
| 2015 | $3,039 | $201,000 | $45,800 | $155,200 |
Source: Public Records
Map
Nearby Homes
- 5 Kendrick St
- 192 Union St
- 89 Newbury St Unit 89B
- 80-82 Haverhill St
- 91 Summer St Unit 2
- 131A Lawrence St Unit 40
- 109 Ferry St
- 129-131 Lexington St
- 39 Swan Ave
- 2 Leslie St
- 14 Court St
- 25-27 Bicknell Ave
- 7-9 Bennington St
- 106 Leroy Ave
- 11 Lawrence St Unit 606
- 12 Annette St
- 264 E Haverhill St Unit 2
- 18 Erhardt Terrace
- 46 Amesbury St Unit 2B
- 32 Josephine Ave
- 7-9 Keighley Ct
- 15 Berkeley St
- 17 Berkeley St
- 21 Berkeley St
- 3 Berkeley Ct
- 1 Berkeley Ct
- 9 Berkeley St Unit 1
- 9 Berkeley St Unit 11
- 11 Berkeley St Unit 1
- 11 Berkeley St Unit 2
- 23 Berkeley St
- 5 Berkeley St
- 6-8 Keighley Ct
- 7 Berkeley St
- 9 Howe Ct Unit 11
- 9 Howe Ct
- 5-7 Berkeley Ct
- 29 Berkeley St
- 90 E Haverhill St
- 88 E Haverhill St
Your Personal Tour Guide
Ask me questions while you tour the home.