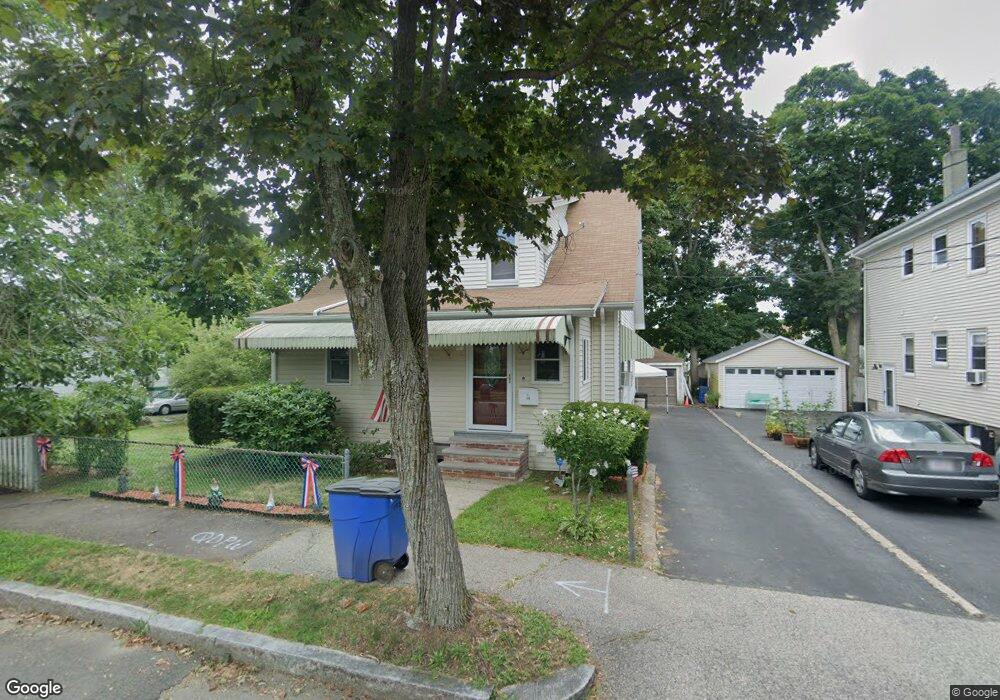
19 Berkeley St Quincy, MA 02169
Quincy Point NeighborhoodEstimated Value: $602,000 - $660,000
4
Beds
2
Baths
1,683
Sq Ft
$380/Sq Ft
Est. Value
About This Home
This home is located at 19 Berkeley St, Quincy, MA 02169 and is currently estimated at $639,031, approximately $379 per square foot. 19 Berkeley St is a home located in Norfolk County with nearby schools including Point Webster Middle School, Clifford H. Marshall Elementary School, and Quincy High School.
Ownership History
Date
Name
Owned For
Owner Type
Purchase Details
Closed on
Apr 18, 2025
Sold by
Muscato Martin E and Muscato Alice
Bought by
Muscato Martin E and Muscato Alice D
Current Estimated Value
Purchase Details
Closed on
Oct 30, 1997
Sold by
Muscato John J Est and Muscato
Bought by
Muscato Martin E and Muscato Alice
Create a Home Valuation Report for This Property
The Home Valuation Report is an in-depth analysis detailing your home's value as well as a comparison with similar homes in the area
Home Values in the Area
Average Home Value in this Area
Purchase History
| Date | Buyer | Sale Price | Title Company |
|---|---|---|---|
| Muscato Martin E | -- | None Available | |
| Muscato Martin E | -- | None Available | |
| Muscato Martin E | $120,000 | -- |
Source: Public Records
Mortgage History
| Date | Status | Borrower | Loan Amount |
|---|---|---|---|
| Previous Owner | Muscato Martin E | $141,500 |
Source: Public Records
Tax History
| Year | Tax Paid | Tax Assessment Tax Assessment Total Assessment is a certain percentage of the fair market value that is determined by local assessors to be the total taxable value of land and additions on the property. | Land | Improvement |
|---|---|---|---|---|
| 2025 | $6,323 | $548,400 | $253,800 | $294,600 |
| 2024 | $6,015 | $533,700 | $241,700 | $292,000 |
| 2023 | $5,482 | $492,500 | $219,800 | $272,700 |
| 2022 | $5,590 | $466,600 | $199,800 | $266,800 |
| 2021 | $5,542 | $456,500 | $199,800 | $256,700 |
| 2020 | $5,489 | $441,600 | $188,500 | $253,100 |
| 2019 | $4,982 | $397,000 | $174,500 | $222,500 |
| 2018 | $5,083 | $381,000 | $158,600 | $222,400 |
| 2017 | $5,142 | $362,900 | $151,100 | $211,800 |
| 2016 | $4,948 | $344,600 | $137,300 | $207,300 |
| 2015 | $4,555 | $312,000 | $129,600 | $182,400 |
| 2014 | $4,333 | $291,600 | $129,600 | $162,000 |
Source: Public Records
Map
Nearby Homes
- 62 South St Unit 7
- 72 Main St
- 51 Sumner St
- 5 Main St
- 123 Elm St Unit D-12
- 33 Elm St
- 101 Sumner St Unit B
- 44 Elm St
- 35 Miller Stile Rd
- 135 Sumner St Unit 1
- 161 Sumner St Unit 2
- 2 Cliveden St Unit 601E
- 2 Cliveden St Unit 405E
- 81-85 Water St
- 388 Washington St Unit 101
- 388 Washington St Unit 302
- 388 Washington St Unit 301
- 388 Washington St Unit 205
- 388 Washington St Unit 401
- 388 Washington St Unit 202
- 15 Berkeley St
- 15 Berkeley St Unit 2
- 27 Berkeley St
- 11 Berkeley St
- 14 Clarendon St
- 16 Clarendon St
- 22 Clarendon St
- 22 Clarendon St Unit One
- 10 Clarendon St
- 22 Berkeley St
- 18 Berkeley St
- 31 Berkeley St
- 28 Berkeley St Unit 2
- 14 Berkeley St
- 26 Berkeley St
- 26 Berkeley St Unit 1
- 28 Clarendon St
- 112 South St
- 110 South St
- 108 South St
Your Personal Tour Guide
Ask me questions while you tour the home.