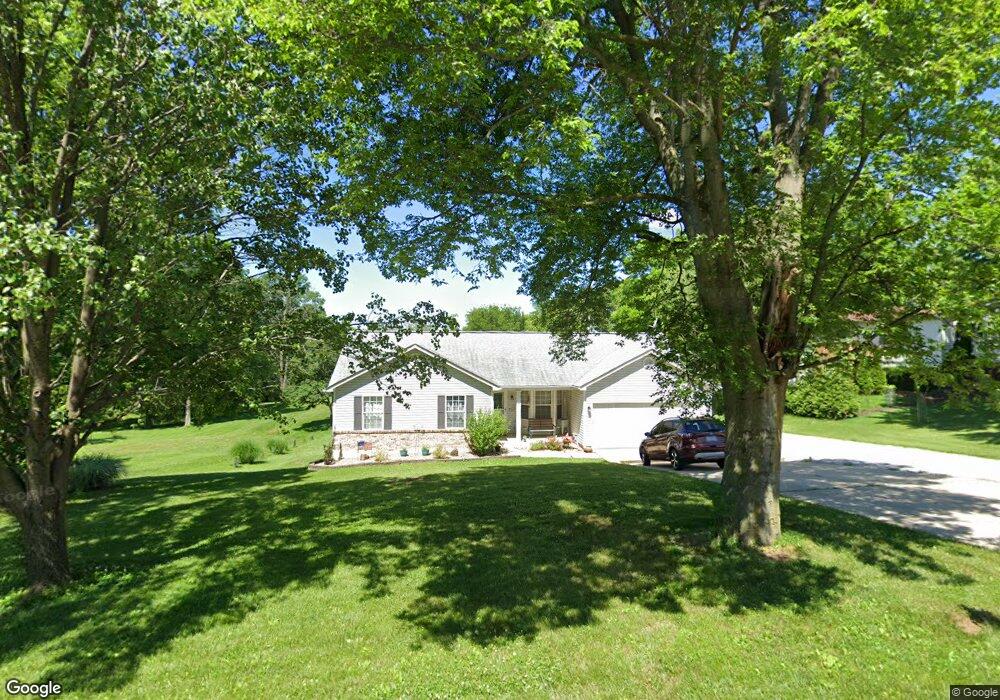
19 Big Dipper Ln Saint Charles, MO 63304
Estimated Value: $360,000 - $414,000
3
Beds
2
Baths
1,489
Sq Ft
$260/Sq Ft
Est. Value
About This Home
This home is located at 19 Big Dipper Ln, Saint Charles, MO 63304 and is currently estimated at $387,827, approximately $260 per square foot. 19 Big Dipper Ln is a home located in St. Charles County with nearby schools including Independence Elementary School, Bryan Middle School, and Francis Howell Union High School.
Ownership History
Date
Name
Owned For
Owner Type
Purchase Details
Closed on
Feb 8, 2019
Sold by
Mcguire May Andrew W and Mcguire May Dawn M
Bought by
Mcguire May Andrew W and Mcguire May Dawn M
Current Estimated Value
Purchase Details
Closed on
Feb 29, 2016
Sold by
May Andrew W and May Dawn M
Bought by
May Andrew and May Dawn M
Home Financials for this Owner
Home Financials are based on the most recent Mortgage that was taken out on this home.
Original Mortgage
$150,000
Outstanding Balance
$65,125
Interest Rate
3.81%
Mortgage Type
New Conventional
Estimated Equity
$322,702
Purchase Details
Closed on
Sep 15, 2011
Sold by
Barnes Seth D and Barnes Joann D
Bought by
May Andrew W
Home Financials for this Owner
Home Financials are based on the most recent Mortgage that was taken out on this home.
Original Mortgage
$159,600
Interest Rate
4.34%
Mortgage Type
New Conventional
Purchase Details
Closed on
Dec 3, 1997
Sold by
Hicks Norman Palmer Lorraine M
Bought by
Barnes Seth D and Barnes Joann D
Create a Home Valuation Report for This Property
The Home Valuation Report is an in-depth analysis detailing your home's value as well as a comparison with similar homes in the area
Home Values in the Area
Average Home Value in this Area
Purchase History
| Date | Buyer | Sale Price | Title Company |
|---|---|---|---|
| Mcguire May Andrew W | -- | None Available | |
| May Andrew | -- | Touchstone Title & Abstract | |
| May Andrew W | $168,000 | Atc | |
| Barnes Seth D | -- | -- |
Source: Public Records
Mortgage History
| Date | Status | Borrower | Loan Amount |
|---|---|---|---|
| Open | May Andrew | $150,000 | |
| Closed | May Andrew W | $159,600 |
Source: Public Records
Tax History
| Year | Tax Paid | Tax Assessment Tax Assessment Total Assessment is a certain percentage of the fair market value that is determined by local assessors to be the total taxable value of land and additions on the property. | Land | Improvement |
|---|---|---|---|---|
| 2025 | $3,571 | $67,305 | -- | -- |
| 2023 | $3,570 | $59,763 | $0 | $0 |
| 2022 | $2,898 | $45,001 | $0 | $0 |
| 2021 | $2,901 | $45,001 | $0 | $0 |
| 2020 | $2,699 | $40,509 | $0 | $0 |
| 2019 | $2,687 | $40,509 | $0 | $0 |
| 2018 | $2,482 | $35,741 | $0 | $0 |
| 2017 | $2,461 | $35,741 | $0 | $0 |
| 2016 | $2,440 | $34,133 | $0 | $0 |
| 2015 | $2,407 | $34,133 | $0 | $0 |
| 2014 | $2,386 | $32,818 | $0 | $0 |
Source: Public Records
Map
Nearby Homes
- 21 Oak Knoll Dr
- 6107 Knights Table Ct
- 502 Beneficial Way
- 69 Castle Bluff Dr
- 950 Haversham Dr
- 3978 Millers Crossing
- 1100 Tower Park Dr
- 74 Mondavi Ct
- 74 S Langfield Ct
- 3912 Jacobs Landing
- 4301 Standing Rock Ct
- 1048 Tower Park Dr
- 17 Acres on Greens Bottom Rd
- 4225 Napa View Ln
- 978 S Brampton Dr
- 4211 Austin Ridge Dr
- 50 Crocknaraw Ln
- 3822 Sirah Ct
- 3927 Rhine Ct
- 742 Oak Leaf Bluff Dr
- 18 Big Dipper Ln
- 17 Big Dipper Ln
- 14 Big Dipper Ln
- 15 Big Dipper Ln
- 13 Big Dipper Ln
- 16 Big Dipper Ln
- 21 Milky Way Dr
- 20 Milky Way Dr
- 20 Milky Way Dr
- 11 N Star Ln
- 22 Milky Way Dr
- 10 N Star Ln
- 12 Milky Way Dr
- 9 N Star Ln
- 23 Milky Way Dr
- 24 Milky Way Dr
- 6 N Star Ln
- 16 Oak Knoll Dr
- 25 Milky Way Dr
- 110 E Wind Dr
Your Personal Tour Guide
Ask me questions while you tour the home.