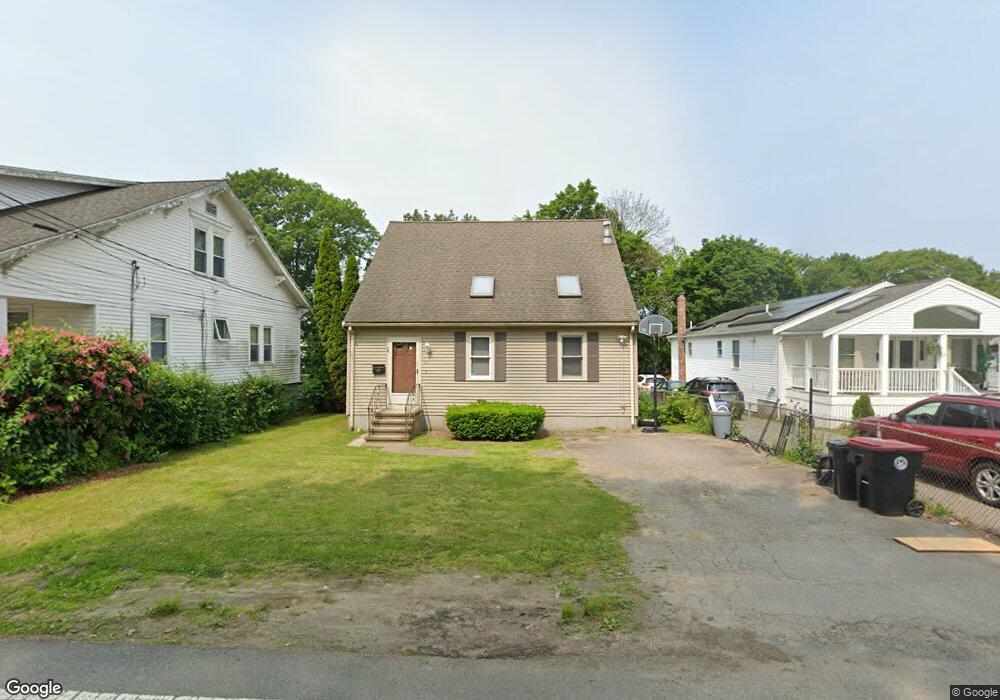
19 Breer St Brockton, MA 02301
Clifton Heights NeighborhoodEstimated Value: $500,000 - $530,332
3
Beds
2
Baths
2,040
Sq Ft
$253/Sq Ft
Est. Value
About This Home
This home is located at 19 Breer St, Brockton, MA 02301 and is currently estimated at $515,333, approximately $252 per square foot. 19 Breer St is a home located in Plymouth County with nearby schools including Gilmore Elementary School, John F. Kennedy Elementary School, and Davis K-8 School.
Ownership History
Date
Name
Owned For
Owner Type
Purchase Details
Closed on
Jun 21, 2010
Sold by
Fox Terry K and Taylor Terry K
Bought by
Kimbrel Cristin E
Current Estimated Value
Home Financials for this Owner
Home Financials are based on the most recent Mortgage that was taken out on this home.
Original Mortgage
$210,788
Outstanding Balance
$140,576
Interest Rate
4.87%
Mortgage Type
FHA
Estimated Equity
$374,757
Purchase Details
Closed on
Feb 7, 1989
Sold by
Fav-Mid Inc
Bought by
Macdonald Michael W
Create a Home Valuation Report for This Property
The Home Valuation Report is an in-depth analysis detailing your home's value as well as a comparison with similar homes in the area
Home Values in the Area
Average Home Value in this Area
Purchase History
| Date | Buyer | Sale Price | Title Company |
|---|---|---|---|
| Kimbrel Cristin E | $217,000 | -- | |
| Macdonald Michael W | $134,900 | -- |
Source: Public Records
Mortgage History
| Date | Status | Borrower | Loan Amount |
|---|---|---|---|
| Open | Kimbrel Cristin E | $210,788 | |
| Previous Owner | Macdonald Michael W | $164,000 | |
| Previous Owner | Macdonald Michael W | $160,000 | |
| Previous Owner | Macdonald Michael W | $135,000 |
Source: Public Records
Tax History
| Year | Tax Paid | Tax Assessment Tax Assessment Total Assessment is a certain percentage of the fair market value that is determined by local assessors to be the total taxable value of land and additions on the property. | Land | Improvement |
|---|---|---|---|---|
| 2025 | $5,442 | $449,400 | $144,300 | $305,100 |
| 2024 | $5,124 | $426,300 | $144,300 | $282,000 |
| 2023 | $4,761 | $366,800 | $109,100 | $257,700 |
| 2022 | $4,423 | $316,600 | $99,100 | $217,500 |
| 2021 | $4,257 | $293,600 | $92,200 | $201,400 |
| 2020 | $1,028 | $293,400 | $88,500 | $204,900 |
| 2019 | $970 | $273,100 | $82,200 | $190,900 |
| 2018 | $3,843 | $239,300 | $82,200 | $157,100 |
| 2017 | $3,399 | $211,100 | $82,200 | $128,900 |
| 2016 | $3,548 | $204,400 | $78,400 | $126,000 |
| 2015 | $3,463 | $190,800 | $78,400 | $112,400 |
| 2014 | $3,323 | $183,300 | $78,400 | $104,900 |
Source: Public Records
Map
Nearby Homes
Your Personal Tour Guide
Ask me questions while you tour the home.