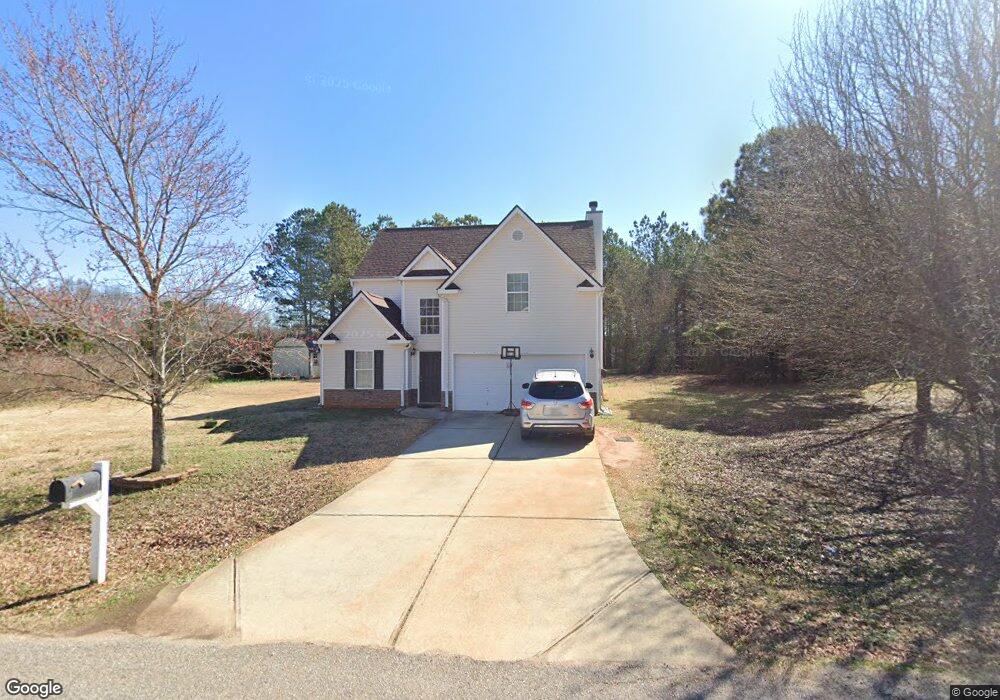
19 Brittany Pointe Dr Unit 19 Colbert, GA 30628
Estimated Value: $319,000 - $338,417
3
Beds
3
Baths
2,065
Sq Ft
$160/Sq Ft
Est. Value
About This Home
This home is located at 19 Brittany Pointe Dr Unit 19, Colbert, GA 30628 and is currently estimated at $330,354, approximately $159 per square foot. 19 Brittany Pointe Dr Unit 19 is a home located in Madison County with nearby schools including Madison County High School.
Ownership History
Date
Name
Owned For
Owner Type
Purchase Details
Closed on
Oct 31, 2018
Sold by
Thrift Zachary P
Bought by
Soto Jose J and Alanis Rebeca
Current Estimated Value
Home Financials for this Owner
Home Financials are based on the most recent Mortgage that was taken out on this home.
Original Mortgage
$166,840
Outstanding Balance
$144,265
Interest Rate
4.7%
Mortgage Type
New Conventional
Estimated Equity
$186,089
Purchase Details
Closed on
Aug 10, 2016
Sold by
Jessica E
Bought by
Thrift Zachary P
Home Financials for this Owner
Home Financials are based on the most recent Mortgage that was taken out on this home.
Original Mortgage
$132,554
Interest Rate
3.87%
Mortgage Type
FHA
Purchase Details
Closed on
Apr 22, 2009
Sold by
Star Home Builders Inc
Bought by
Beri Jessica E and Beri Patrick G
Home Financials for this Owner
Home Financials are based on the most recent Mortgage that was taken out on this home.
Original Mortgage
$136,020
Interest Rate
4.86%
Mortgage Type
New Conventional
Create a Home Valuation Report for This Property
The Home Valuation Report is an in-depth analysis detailing your home's value as well as a comparison with similar homes in the area
Purchase History
| Date | Buyer | Sale Price | Title Company |
|---|---|---|---|
| Soto Jose J | $172,000 | -- | |
| Thrift Zachary P | $135,000 | -- | |
| Beri Jessica E | $133,300 | -- |
Source: Public Records
Mortgage History
| Date | Status | Borrower | Loan Amount |
|---|---|---|---|
| Open | Soto Jose J | $166,840 | |
| Previous Owner | Thrift Zachary P | $132,554 | |
| Previous Owner | Beri Jessica E | $136,020 |
Source: Public Records
Tax History
| Year | Tax Paid | Tax Assessment Tax Assessment Total Assessment is a certain percentage of the fair market value that is determined by local assessors to be the total taxable value of land and additions on the property. | Land | Improvement |
|---|---|---|---|---|
| 2025 | $3,275 | $128,888 | $6,766 | $122,122 |
| 2024 | $3,253 | $124,971 | $6,766 | $118,205 |
| 2023 | $3,576 | $117,138 | $6,766 | $110,372 |
| 2022 | $2,842 | $103,055 | $6,766 | $96,289 |
| 2021 | $2,296 | $75,223 | $6,766 | $68,457 |
| 2020 | $2,121 | $69,000 | $6,766 | $62,234 |
| 2019 | $1,894 | $60,896 | $6,090 | $54,806 |
| 2018 | $1,840 | $58,988 | $6,090 | $52,898 |
| 2017 | $1,570 | $54,524 | $6,766 | $47,758 |
| 2016 | $1,633 | $56,878 | $6,766 | $50,112 |
| 2015 | $1,345 | $46,856 | $6,766 | $40,090 |
| 2014 | $1,354 | $46,856 | $6,766 | $40,090 |
| 2013 | -- | $46,856 | $6,766 | $40,090 |
Source: Public Records
Map
Nearby Homes
- 162 Brittany Pointe Dr
- 75 Madison Ave
- 142 Rolling Woods Ln Unit 29
- 142 Rolling Woods Ln
- 1 Lem Edwards Rd
- 2 Lem Edwards Rd
- 1175 Diamond Hill Colbert Rd
- 1330 McCannon-morris Rd
- 2596 Hardman Morris Rd
- 467 Diamond Hill Colbert Rd
- 120 Grace Ln Unit 6
- 489 Childers Rd
- 176 Grace Ln Unit 5
- 1618 McCannon Morris Rd
- 8576 Highway 72 W
- 0 2nd Ave
- 2477 Shoal Creek Rd
- 0 Spratlin Mill Dr Unit 7665837
- 0 Spratlin Mill Dr Unit LOT 14-C
- 0 Old Kincaid Rd Unit CL336310
- 19 Brittany Pointe Dr
- 1 Brittany Pointe Dr
- 41 Brittany Pointe Dr
- 40 Brittany Pointe Dr
- 55 Brittany Pointe Dr
- 55 Brittany Pointe Dr
- 58 Brittany Pointe Dr
- 484 Foote McClellan Rd
- 448 Sorrow Patterson Rd
- 71 Brittany Pointe Dr
- 430 Sorrow Patterson Rd
- 84 Brittany Pointe Dr
- 89 Brittany Pointe Dr
- 552 Foote McClellan Rd
- 106 Brittany Pointe Dr
- 390 Sorrow Patterson Rd
- 145 Brittany Pointe Dr
- 368 Sorrow Patterson Rd
- 355 Foote McClellan Rd
- 601 Sorrow Patterson Rd
Your Personal Tour Guide
Ask me questions while you tour the home.