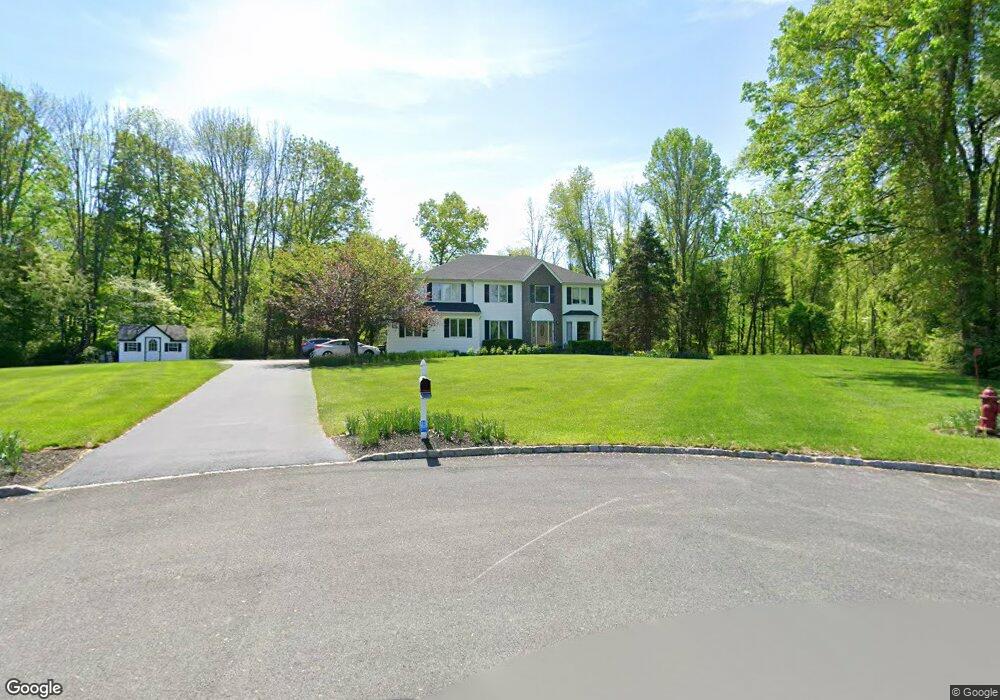
19 Bromley Ct Sparta, NJ 07871
Estimated Value: $773,000 - $954,000
Studio
--
Bath
2,766
Sq Ft
$303/Sq Ft
Est. Value
About This Home
This home is located at 19 Bromley Ct, Sparta, NJ 07871 and is currently estimated at $837,675, approximately $302 per square foot. 19 Bromley Ct is a home located in Sussex County with nearby schools including Sparta High School, Reverand George A. Brown School, and Alpine Montessori - Sparta.
Ownership History
Date
Name
Owned For
Owner Type
Purchase Details
Closed on
Nov 21, 2000
Sold by
Cendant Mobility Services Corp
Bought by
Kessler Peter W and Kessler Carol B
Current Estimated Value
Home Financials for this Owner
Home Financials are based on the most recent Mortgage that was taken out on this home.
Original Mortgage
$252,700
Outstanding Balance
$91,918
Interest Rate
7.7%
Estimated Equity
$745,757
Purchase Details
Closed on
Aug 28, 1998
Sold by
Schwartz Jacques P and Schwartz Mary
Bought by
Cendent Mobility Service and Basf Corp
Purchase Details
Closed on
Dec 17, 1993
Sold by
Llewellyn A Spoarta Inc
Bought by
Swartz Mary and Swartz Jacques P
Home Financials for this Owner
Home Financials are based on the most recent Mortgage that was taken out on this home.
Original Mortgage
$255,000
Interest Rate
7.03%
Create a Home Valuation Report for This Property
The Home Valuation Report is an in-depth analysis detailing your home's value as well as a comparison with similar homes in the area
Home Values in the Area
Average Home Value in this Area
Purchase History
| Date | Buyer | Sale Price | Title Company |
|---|---|---|---|
| Kessler Peter W | $380,000 | Commonwealth Land Title Ins | |
| Cendent Mobility Service | $330,000 | -- | |
| Swartz Mary | $319,000 | -- |
Source: Public Records
Mortgage History
| Date | Status | Borrower | Loan Amount |
|---|---|---|---|
| Open | Kessler Peter W | $252,700 | |
| Previous Owner | Swartz Mary | $255,000 |
Source: Public Records
Tax History
| Year | Tax Paid | Tax Assessment Tax Assessment Total Assessment is a certain percentage of the fair market value that is determined by local assessors to be the total taxable value of land and additions on the property. | Land | Improvement |
|---|---|---|---|---|
| 2025 | $14,902 | $415,200 | $164,700 | $250,500 |
| 2024 | $14,474 | $415,200 | $164,700 | $250,500 |
Source: Public Records
Map
Nearby Homes
- 274 Alpine Trail
- 39 Summit Terrace
- 41 Summit Rd
- 40 Summit Terrace
- 53 Oakwood Trail
- 32 Seneca Trail
- 35 Seneca Trail
- 194 Andover Rd
- 65 Ledgewood Trail
- 43 Ledgewood Trail
- 583 W Shore Trail
- 32 Heighwood Trail
- 590 W Shore Trail
- 40 Westgate Dr
- 18 Sagamore Trail
- 15 Laurel Terrace
- 107 Valley View Trail
- 20 Island Trail
- 351 E Shore Trail
- 190 W Shore Trail
Your Personal Tour Guide
Ask me questions while you tour the home.