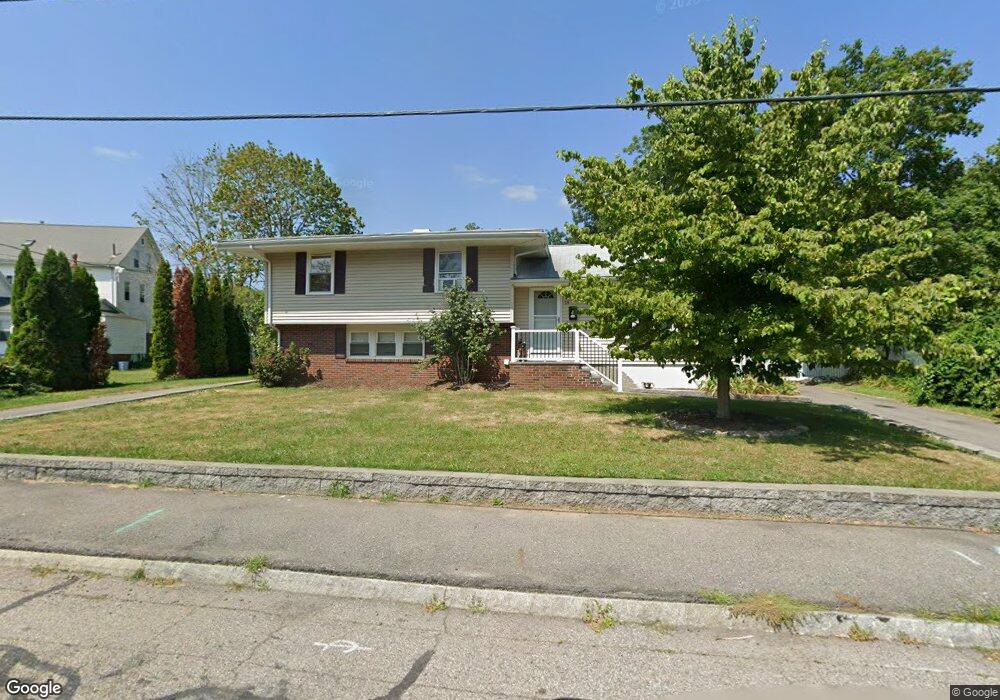
19 Bryant St Taunton, MA 02780
City Center NeighborhoodEstimated Value: $481,000 - $543,000
4
Beds
3
Baths
1,752
Sq Ft
$296/Sq Ft
Est. Value
About This Home
This home is located at 19 Bryant St, Taunton, MA 02780 and is currently estimated at $518,334, approximately $295 per square foot. 19 Bryant St is a home located in Bristol County with nearby schools including Elizabeth Pole School, Taunton High School, and Joseph H. Martin.
Ownership History
Date
Name
Owned For
Owner Type
Purchase Details
Closed on
Mar 9, 2010
Sold by
Bernardino Kerry and Bernardino Jodi
Bought by
Fuqua Emily C and Webb William E
Current Estimated Value
Home Financials for this Owner
Home Financials are based on the most recent Mortgage that was taken out on this home.
Original Mortgage
$230,743
Outstanding Balance
$153,084
Interest Rate
5%
Mortgage Type
Purchase Money Mortgage
Estimated Equity
$365,250
Purchase Details
Closed on
Dec 18, 2007
Sold by
Keeping Roberta J
Bought by
Bernardino Kerry and Bernardino Jodi
Home Financials for this Owner
Home Financials are based on the most recent Mortgage that was taken out on this home.
Original Mortgage
$110,000
Interest Rate
6.3%
Mortgage Type
Purchase Money Mortgage
Create a Home Valuation Report for This Property
The Home Valuation Report is an in-depth analysis detailing your home's value as well as a comparison with similar homes in the area
Home Values in the Area
Average Home Value in this Area
Purchase History
| Date | Buyer | Sale Price | Title Company |
|---|---|---|---|
| Fuqua Emily C | $235,000 | -- | |
| Bernardino Kerry | $266,500 | -- |
Source: Public Records
Mortgage History
| Date | Status | Borrower | Loan Amount |
|---|---|---|---|
| Open | Fuqua Emily C | $230,743 | |
| Previous Owner | Bernardino Kerry | $110,000 |
Source: Public Records
Tax History Compared to Growth
Tax History
| Year | Tax Paid | Tax Assessment Tax Assessment Total Assessment is a certain percentage of the fair market value that is determined by local assessors to be the total taxable value of land and additions on the property. | Land | Improvement |
|---|---|---|---|---|
| 2025 | $4,372 | $399,600 | $104,200 | $295,400 |
| 2024 | $4,279 | $382,400 | $104,200 | $278,200 |
| 2023 | $3,921 | $325,400 | $104,200 | $221,200 |
| 2022 | $3,845 | $291,700 | $86,800 | $204,900 |
| 2021 | $3,499 | $246,400 | $78,900 | $167,500 |
| 2020 | $3,370 | $226,800 | $78,900 | $147,900 |
| 2019 | $3,447 | $218,700 | $78,900 | $139,800 |
| 2018 | $3,224 | $205,100 | $79,600 | $125,500 |
| 2017 | $3,181 | $202,500 | $75,400 | $127,100 |
| 2016 | $3,064 | $195,400 | $73,200 | $122,200 |
| 2015 | $3,022 | $201,300 | $72,500 | $128,800 |
| 2014 | $3,059 | $209,400 | $72,200 | $137,200 |
Source: Public Records
Map
Nearby Homes
- 215 High St Unit 21
- 215 High St Unit 20
- 6 W Summer St
- 16 Clinton St
- 0, M64 L51 Knapp St
- 0 M64 L39 Knapp St
- 0, M64 L49 Knapp St
- 0, M64 L50 Knapp St
- 46 Harrison St Unit 4
- 4 Parkin Ct
- 48 Taunton Green
- 278 Cohannet St
- 24 1st St
- 98 Winthrop St
- 31 Church Green Unit 303
- 72 Barnum St
- 19 Mason St
- 1301 Carriage Ln Unit 1301
- 132 Winthrop St
- 5 Dean Ave
- 17 Bryant St
- 8 Sumner St
- 6 Sumner St
- 6 Sumner St Unit 2
- 14 Sumner St
- 22 Bryant St
- 20 Bryant St
- 15 Bryant St
- 16 Sumner St
- 246 Weir St
- 246 Weir St Unit 1
- 35 Newcomb Place
- 35 Newcomb Place Unit 3
- 35 Newcomb Place Unit 2
- 35 Newcomb Place Unit 1
- 16 Bryant St
- 18 Sumner St
- 242 Weir St
- 242 Weir St Unit 1
- 7 Sumner St