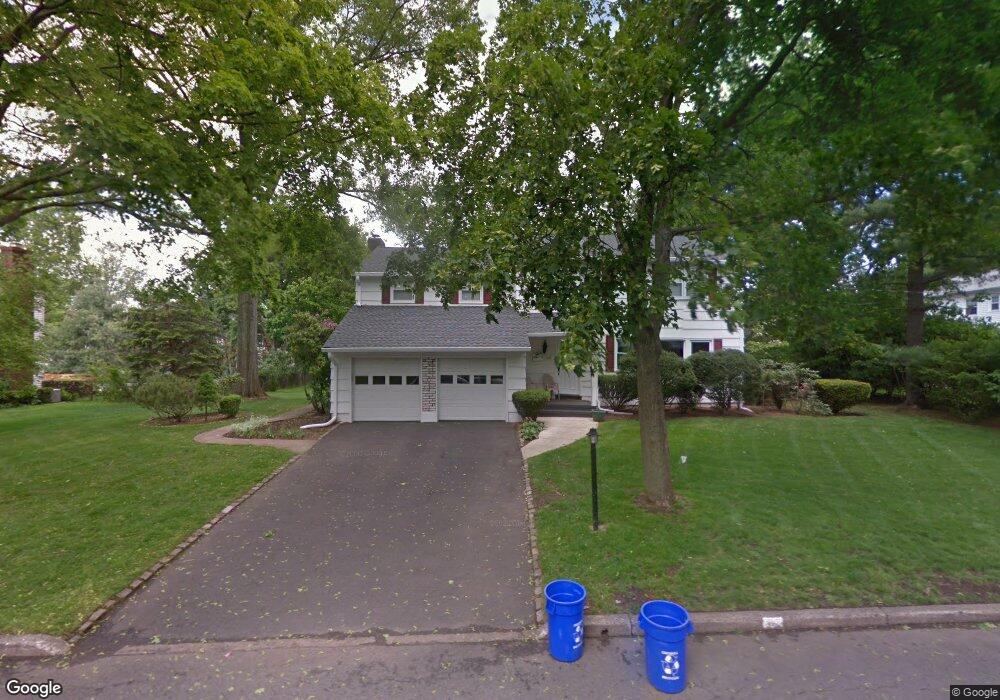
19 Buckingham Rd Cresskill, NJ 07626
Estimated Value: $1,386,000 - $1,703,704
Studio
--
Bath
3,365
Sq Ft
$466/Sq Ft
Est. Value
About This Home
This home is located at 19 Buckingham Rd, Cresskill, NJ 07626 and is currently estimated at $1,566,926, approximately $465 per square foot. 19 Buckingham Rd is a home located in Bergen County with nearby schools including Cresskill High School, Spring School, and Academy Of The Holy Angels.
Ownership History
Date
Name
Owned For
Owner Type
Purchase Details
Closed on
Mar 17, 2009
Sold by
Rambusek Eleanor
Bought by
David Mark and David Stephanie C
Current Estimated Value
Home Financials for this Owner
Home Financials are based on the most recent Mortgage that was taken out on this home.
Original Mortgage
$560,000
Outstanding Balance
$358,343
Interest Rate
5.25%
Mortgage Type
Purchase Money Mortgage
Estimated Equity
$1,208,583
Purchase Details
Closed on
Jan 8, 2009
Sold by
Rambusek Joseph and Rambusek Eleanor
Bought by
Rambusek Eleanor
Create a Home Valuation Report for This Property
The Home Valuation Report is an in-depth analysis detailing your home's value as well as a comparison with similar homes in the area
Home Values in the Area
Average Home Value in this Area
Purchase History
| Date | Buyer | Sale Price | Title Company |
|---|---|---|---|
| David Mark | $700,000 | -- | |
| Rambusek Eleanor | -- | -- |
Source: Public Records
Mortgage History
| Date | Status | Borrower | Loan Amount |
|---|---|---|---|
| Open | David Mark | $560,000 |
Source: Public Records
Tax History
| Year | Tax Paid | Tax Assessment Tax Assessment Total Assessment is a certain percentage of the fair market value that is determined by local assessors to be the total taxable value of land and additions on the property. | Land | Improvement |
|---|---|---|---|---|
| 2025 | $24,778 | $1,122,000 | $533,900 | $588,100 |
| 2024 | $23,656 | $1,077,300 | $511,400 | $565,900 |
| 2023 | $22,705 | $1,019,200 | $468,900 | $550,300 |
| 2022 | $22,705 | $943,300 | $415,200 | $528,100 |
| 2021 | $22,430 | $918,500 | $406,200 | $512,300 |
| 2020 | $22,029 | $905,800 | $402,700 | $503,100 |
| 2019 | $16,365 | $679,900 | $399,200 | $280,700 |
| 2018 | $11,381 | $675,000 | $396,200 | $278,800 |
| 2017 | $17,279 | $634,800 | $358,100 | $276,700 |
| 2016 | $16,765 | $634,800 | $358,100 | $276,700 |
| 2015 | $16,245 | $634,800 | $358,100 | $276,700 |
| 2014 | $15,756 | $634,800 | $358,100 | $276,700 |
Source: Public Records
Map
Nearby Homes