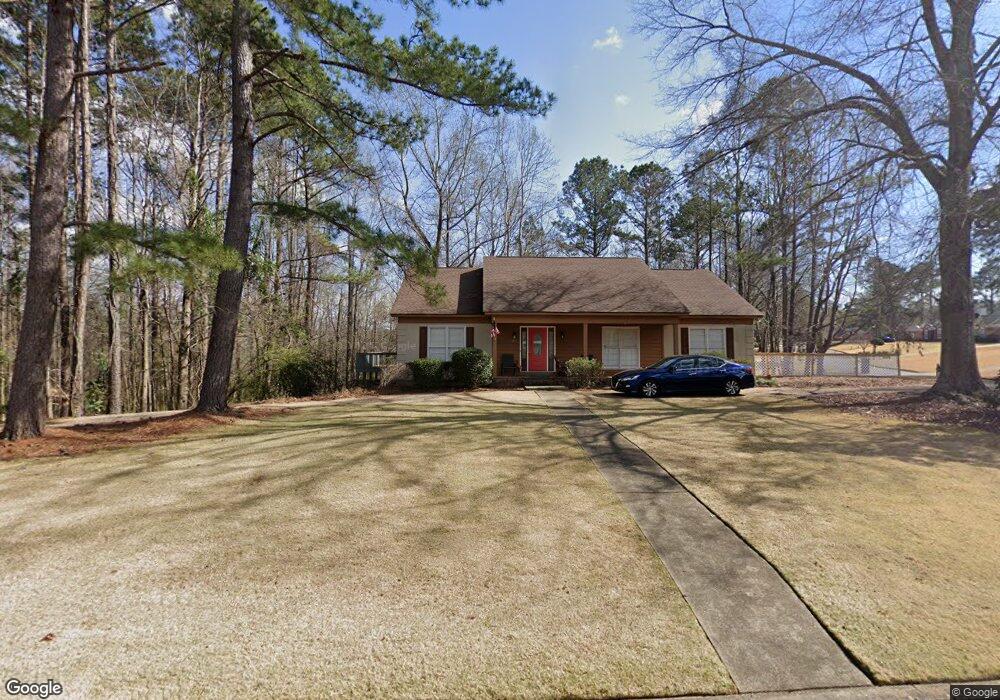
19 Bugle Brook Ct Midland, GA 31820
Midland NeighborhoodEstimated Value: $346,328 - $399,000
3
Beds
3
Baths
1,980
Sq Ft
$188/Sq Ft
Est. Value
About This Home
This home is located at 19 Bugle Brook Ct, Midland, GA 31820 and is currently estimated at $372,582, approximately $188 per square foot. 19 Bugle Brook Ct is a home located in Harris County with nearby schools including Pine Ridge Elementary School, Creekside School, and Harris County Carver Middle School.
Ownership History
Date
Name
Owned For
Owner Type
Purchase Details
Closed on
Aug 31, 1994
Bought by
Carter James D and Carter Rebecca C
Current Estimated Value
Create a Home Valuation Report for This Property
The Home Valuation Report is an in-depth analysis detailing your home's value as well as a comparison with similar homes in the area
Home Values in the Area
Average Home Value in this Area
Purchase History
| Date | Buyer | Sale Price | Title Company |
|---|---|---|---|
| Carter James D | $146,000 | -- |
Source: Public Records
Tax History
| Year | Tax Paid | Tax Assessment Tax Assessment Total Assessment is a certain percentage of the fair market value that is determined by local assessors to be the total taxable value of land and additions on the property. | Land | Improvement |
|---|---|---|---|---|
| 2025 | $3,945 | $148,829 | $16,000 | $132,829 |
| 2024 | $3,668 | $135,995 | $16,000 | $119,995 |
| 2023 | $2,671 | $115,884 | $16,000 | $99,884 |
| 2022 | $3,132 | $115,884 | $16,000 | $99,884 |
| 2021 | $3,120 | $111,344 | $16,000 | $95,344 |
| 2020 | $2,635 | $93,782 | $16,000 | $77,782 |
| 2019 | $2,541 | $93,782 | $16,000 | $77,782 |
| 2018 | $2,593 | $93,782 | $16,000 | $77,782 |
| 2017 | $2,594 | $93,782 | $16,000 | $77,782 |
| 2016 | $2,369 | $93,786 | $16,000 | $77,786 |
| 2015 | $2,109 | $83,099 | $16,000 | $67,099 |
| 2014 | $2,113 | $83,099 | $16,000 | $67,099 |
| 2013 | -- | $83,098 | $16,000 | $67,098 |
Source: Public Records
Map
Nearby Homes
- 54 Day Lake Dr
- 9610 County Line Rd
- 1009 Crosswinds Dr
- 51 Ironwood Ct
- 51 Ironwood Ct Unit 90
- 10304 Emerson Way
- 178 Rolling Farm Way
- 0 County Line Rd Unit 10697324
- 0 County Line Rd Unit 228142
- 10543 County Line Rd
- 112 Ironwood Way Unit 83
- 112 Ironwood Way
- 8848 Westwind Dr
- 8904 Lilly Rock Way
- 1225 Rocky Shoals Dr
- 8816 Westwind Dr
- 8519 Liberty Hall Dr
- 1049 Crosswinds Dr
- 445 Scooter Dr
- 10176 Sable Ct
- 37 Bugle Brook Ct
- 241 Day Lake Dr
- 16 Bugle Brook Ct
- 67 Bugle Brook Ct
- 32 Bugle Brook Ct
- 54 Bugle Brook Ct
- 268 Day Lake Dr
- 84 Bugle Brook Ct
- 109 Bugle Brook Ct
- 47 Hunting Creek Way
- 85 Hunting Creek Way
- 237 Day Lake Dr
- 227 Hunting Creek Way
- 0 Hunting Creek Way Unit 3038271
- 82 Lake Point Trail
- 107 Hunting Creek Way
- 76 Lake Point Trail
- 151 Bugle Brook Ct
- 173 Hunting Creek Way
- 120 Bugle Brook Ct
Your Personal Tour Guide
Ask me questions while you tour the home.