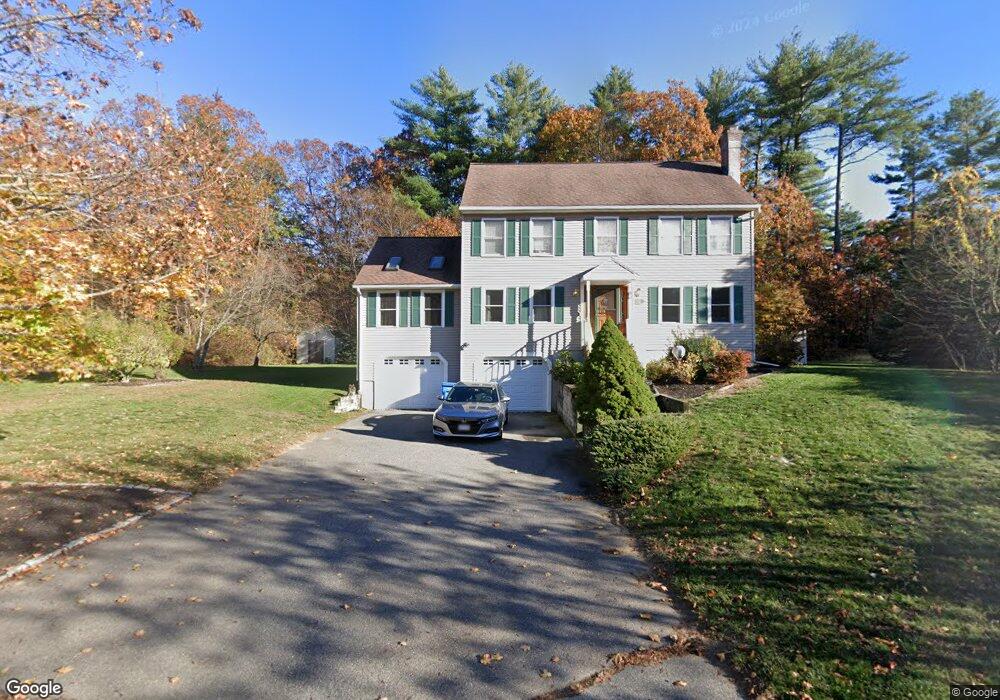
19 Burnside Ln Merrimac, MA 01860
Estimated Value: $732,000 - $854,000
3
Beds
3
Baths
2,180
Sq Ft
$363/Sq Ft
Est. Value
About This Home
This home is located at 19 Burnside Ln, Merrimac, MA 01860 and is currently estimated at $790,594, approximately $362 per square foot. 19 Burnside Ln is a home located in Essex County with nearby schools including Pentucket Regional High School.
Ownership History
Date
Name
Owned For
Owner Type
Purchase Details
Closed on
Jun 12, 2015
Sold by
Hopkins John A and Hopkins Sharon E
Bought by
Fahey Michael W and Fahey Tanasi A
Current Estimated Value
Home Financials for this Owner
Home Financials are based on the most recent Mortgage that was taken out on this home.
Original Mortgage
$371,250
Outstanding Balance
$286,513
Interest Rate
3.65%
Mortgage Type
New Conventional
Estimated Equity
$504,081
Purchase Details
Closed on
May 27, 1997
Sold by
Griffin Paul E and Griffin Deborah L
Bought by
Hopkins John A and Hopkins Sharon E
Purchase Details
Closed on
Jun 30, 1994
Sold by
Homes By Chet Inc
Bought by
Griffin Paul E and Griffin Deborah
Create a Home Valuation Report for This Property
The Home Valuation Report is an in-depth analysis detailing your home's value as well as a comparison with similar homes in the area
Home Values in the Area
Average Home Value in this Area
Purchase History
| Date | Buyer | Sale Price | Title Company |
|---|---|---|---|
| Fahey Michael W | $412,500 | -- | |
| Hopkins John A | $217,000 | -- | |
| Griffin Paul E | $195,110 | -- |
Source: Public Records
Mortgage History
| Date | Status | Borrower | Loan Amount |
|---|---|---|---|
| Open | Fahey Michael W | $371,250 | |
| Previous Owner | Griffin Paul E | $85,000 | |
| Previous Owner | Griffin Paul E | $122,000 | |
| Previous Owner | Griffin Paul E | $38,000 |
Source: Public Records
Tax History Compared to Growth
Tax History
| Year | Tax Paid | Tax Assessment Tax Assessment Total Assessment is a certain percentage of the fair market value that is determined by local assessors to be the total taxable value of land and additions on the property. | Land | Improvement |
|---|---|---|---|---|
| 2025 | $9,368 | $707,000 | $359,700 | $347,300 |
| 2024 | $9,489 | $702,900 | $359,700 | $343,200 |
| 2023 | $8,818 | $597,000 | $311,700 | $285,300 |
| 2022 | $8,289 | $507,300 | $259,800 | $247,500 |
| 2021 | $8,269 | $507,300 | $259,800 | $247,500 |
| 2020 | $7,549 | $507,300 | $259,800 | $247,500 |
| 2019 | $6,794 | $429,700 | $191,800 | $237,900 |
| 2018 | $6,383 | $405,000 | $171,900 | $233,100 |
| 2017 | $6,498 | $397,700 | $171,900 | $225,800 |
| 2016 | $6,348 | $392,800 | $171,900 | $220,900 |
| 2015 | $6,107 | $375,800 | $171,900 | $203,900 |
| 2014 | $5,971 | $375,800 | $171,900 | $203,900 |
Source: Public Records
Map
Nearby Homes