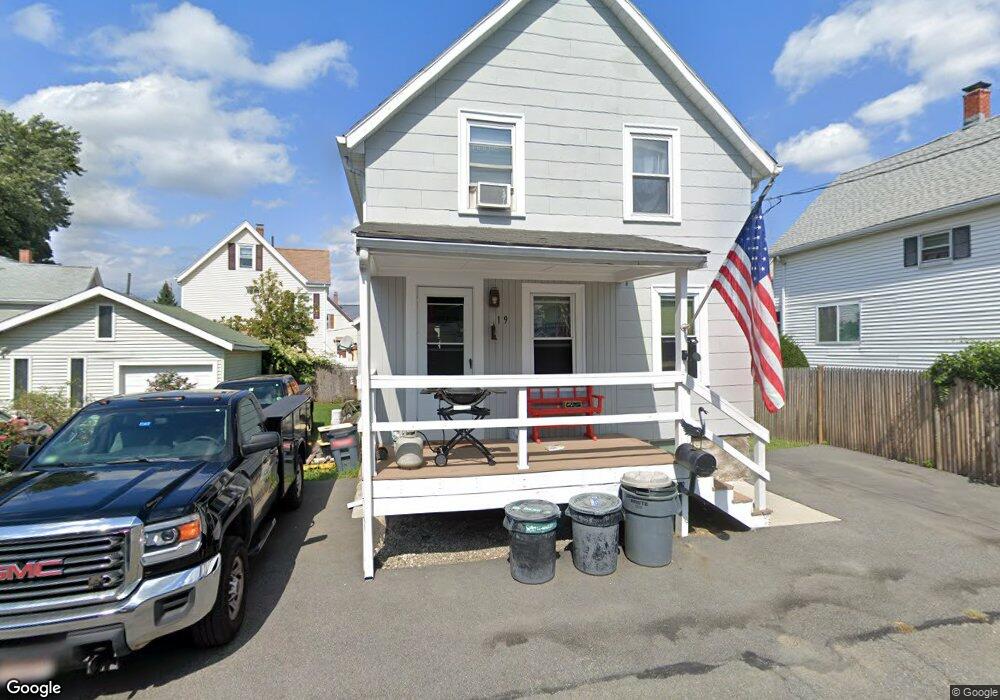
19 Byron St Malden, MA 02148
Linden NeighborhoodEstimated Value: $541,000 - $627,000
3
Beds
2
Baths
990
Sq Ft
$597/Sq Ft
Est. Value
About This Home
This home is located at 19 Byron St, Malden, MA 02148 and is currently estimated at $591,075, approximately $597 per square foot. 19 Byron St is a home located in Middlesex County with nearby schools including Malden High School and Malden Catholic.
Ownership History
Date
Name
Owned For
Owner Type
Purchase Details
Closed on
Oct 27, 2006
Sold by
Duck John F and Duck Linda A
Bought by
Duck John F
Current Estimated Value
Home Financials for this Owner
Home Financials are based on the most recent Mortgage that was taken out on this home.
Original Mortgage
$270,000
Outstanding Balance
$162,120
Interest Rate
6.48%
Mortgage Type
Purchase Money Mortgage
Estimated Equity
$428,955
Create a Home Valuation Report for This Property
The Home Valuation Report is an in-depth analysis detailing your home's value as well as a comparison with similar homes in the area
Home Values in the Area
Average Home Value in this Area
Purchase History
| Date | Buyer | Sale Price | Title Company |
|---|---|---|---|
| Duck John F | $285,000 | -- |
Source: Public Records
Mortgage History
| Date | Status | Borrower | Loan Amount |
|---|---|---|---|
| Open | Duck John F | $270,000 |
Source: Public Records
Tax History Compared to Growth
Tax History
| Year | Tax Paid | Tax Assessment Tax Assessment Total Assessment is a certain percentage of the fair market value that is determined by local assessors to be the total taxable value of land and additions on the property. | Land | Improvement |
|---|---|---|---|---|
| 2025 | $54 | $479,100 | $271,200 | $207,900 |
| 2024 | $5,138 | $439,500 | $256,200 | $183,300 |
| 2023 | $5,034 | $413,000 | $233,600 | $179,400 |
| 2022 | $4,758 | $385,300 | $211,000 | $174,300 |
| 2021 | $4,804 | $390,900 | $188,400 | $202,500 |
| 2020 | $4,681 | $370,000 | $182,000 | $188,000 |
| 2019 | $4,503 | $339,300 | $173,300 | $166,000 |
| 2018 | $4,257 | $302,100 | $143,200 | $158,900 |
| 2017 | $4,082 | $288,100 | $137,500 | $150,600 |
| 2016 | $3,550 | $234,200 | $126,200 | $108,000 |
| 2015 | $3,470 | $220,600 | $120,200 | $100,400 |
| 2014 | $3,317 | $206,000 | $109,300 | $96,700 |
Source: Public Records
Map
Nearby Homes
- 23 Byron St
- 11 Byron St
- 26 Silver St
- 22 Byron St
- 20 Silver St
- 16 Byron St
- 30 Silver St
- 12 Silver St
- 180 Broadway
- 180 Broadway Unit 14
- 180 Broadway Unit 23
- 180 Broadway Unit 17
- 180 Broadway Unit 19
- 180 Broadway Unit 12
- 180 Broadway Unit 10
- 180 Broadway Unit 7
- 180 Broadway Unit 5
- 180 Broadway Unit 2
- 180 Broadway Unit 4
- 180 Broadway Unit 3