Estimated Value: $464,518 - $585,000
6
Beds
2
Baths
2,147
Sq Ft
$243/Sq Ft
Est. Value
About This Home
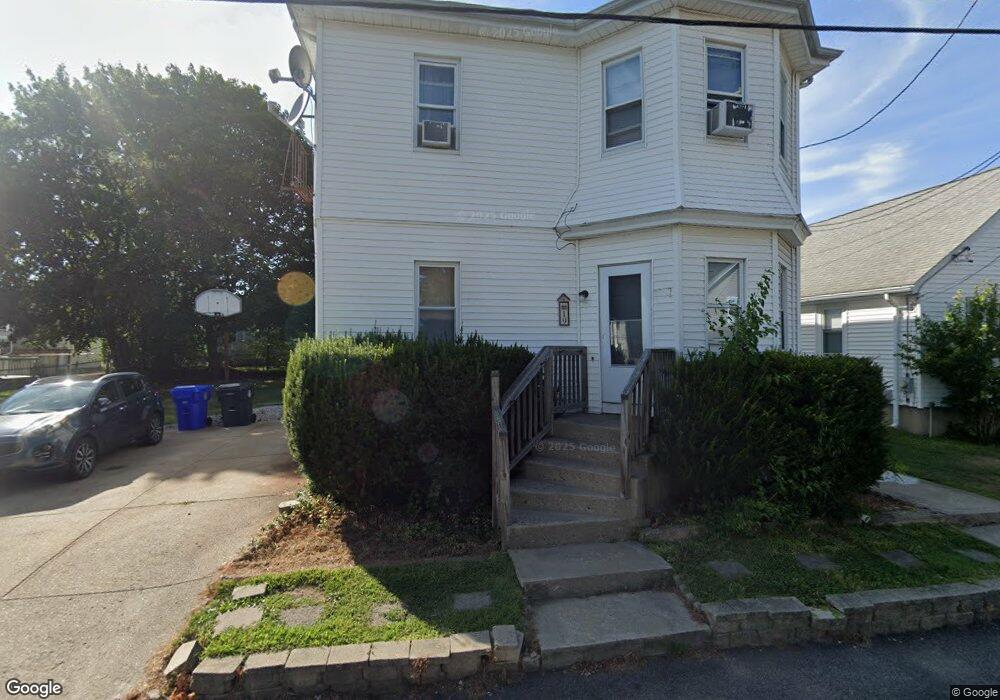
This home is located at 19 Byron St, North Providence, RI 02911 and is currently estimated at $522,630, approximately $243 per square foot. 19 Byron St is a home located in Providence County with nearby schools including North Providence High School, St. Thomas Regional School, and St. Augustine School.
Ownership History
Date
Name
Owned For
Owner Type
Purchase Details
Closed on
Aug 25, 2020
Sold by
Tiernan Ryan D and Lombardi Danielle M
Bought by
Tiernan Ryan D and Tiernan Danielle M
Current Estimated Value
Home Financials for this Owner
Home Financials are based on the most recent Mortgage that was taken out on this home.
Original Mortgage
$162,000
Outstanding Balance
$113,940
Interest Rate
2.9%
Mortgage Type
New Conventional
Estimated Equity
$408,690
Purchase Details
Closed on
Jun 18, 2004
Sold by
Pryor Robert T and Pryor Debra A
Bought by
Tiernan Ryan D and Lombardi Danielle M
Home Financials for this Owner
Home Financials are based on the most recent Mortgage that was taken out on this home.
Original Mortgage
$265,168
Interest Rate
6.12%
Mortgage Type
Purchase Money Mortgage
Create a Home Valuation Report for This Property
The Home Valuation Report is an in-depth analysis detailing your home's value as well as a comparison with similar homes in the area
Home Values in the Area
Average Home Value in this Area
Purchase History
| Date | Buyer | Sale Price | Title Company |
|---|---|---|---|
| Tiernan Ryan D | -- | None Available | |
| Tiernan Ryan D | -- | None Available | |
| Tiernan Ryan D | -- | None Available | |
| Tiernan Ryan D | $275,000 | -- | |
| Tiernan Ryan D | $275,000 | -- |
Source: Public Records
Mortgage History
| Date | Status | Borrower | Loan Amount |
|---|---|---|---|
| Open | Tiernan Ryan D | $162,000 | |
| Closed | Tiernan Ryan D | $162,000 | |
| Previous Owner | Tiernan Ryan D | $257,628 | |
| Previous Owner | Tiernan Ryan D | $270,400 | |
| Previous Owner | Tiernan Ryan D | $265,168 |
Source: Public Records
Tax History Compared to Growth
Tax History
| Year | Tax Paid | Tax Assessment Tax Assessment Total Assessment is a certain percentage of the fair market value that is determined by local assessors to be the total taxable value of land and additions on the property. | Land | Improvement |
|---|---|---|---|---|
| 2025 | $6,385 | $363,200 | $88,900 | $274,300 |
| 2024 | $6,033 | $363,200 | $88,900 | $274,300 |
| 2023 | $6,033 | $363,200 | $88,900 | $274,300 |
| 2022 | $5,661 | $248,200 | $68,400 | $179,800 |
| 2021 | $5,661 | $248,200 | $68,400 | $179,800 |
| 2020 | $5,661 | $248,200 | $68,400 | $179,800 |
| 2017 | $5,395 | $206,400 | $52,700 | $153,700 |
| 2016 | $4,758 | $170,300 | $56,000 | $114,300 |
| 2015 | $4,758 | $170,300 | $56,000 | $114,300 |
| 2014 | $8,282 | $170,300 | $56,000 | $114,300 |
Source: Public Records
Map
Nearby Homes
- 1884 Smith St
- 1875 Smith St
- 27 Ferncliff Ave
- 1854 Smith St
- 95 Angell Ave
- 4 Hatherly St
- 2160 Mineral Spring Ave Unit Springdale B1 U1
- 31 Swan St
- 40 Grover St
- 494 Woonasquatucket Ave Unit 209
- 494 Woonasquatucket Ave Unit 107
- 494 Woonasquatucket Ave Unit 111
- 494 Woonasquatucket Ave Unit 413
- 494 Woonasquatucket Ave Unit 210
- 22 Whipple Ave
- 0 Villa Dr
- 2008 Mineral Spring Ave Unit 3
- 29 Zipporah St
- 397 George Waterman Rd
- 31 Columbus Ave
- 27 Byron St Unit 29
- 17 Byron St
- 43 Ferncliff Ave
- 31 Byron St
- 35 Ferncliff Ave
- 15 Byron St
- 28 Halsey St
- 16 Byron St
- 30 Byron St
- 37 Ferncliff Ave
- 29 Halsey St
- 50 Ferncliff Ave
- 37 Byron St
- 17 Peach Hill Ave
- 44 Ferncliff Ave
- 1890 Smith St
- 1894 Smith St
- 23 Peach Hill Ave
- 15 Peach Hill Ave
- 40 Ferncliff Ave