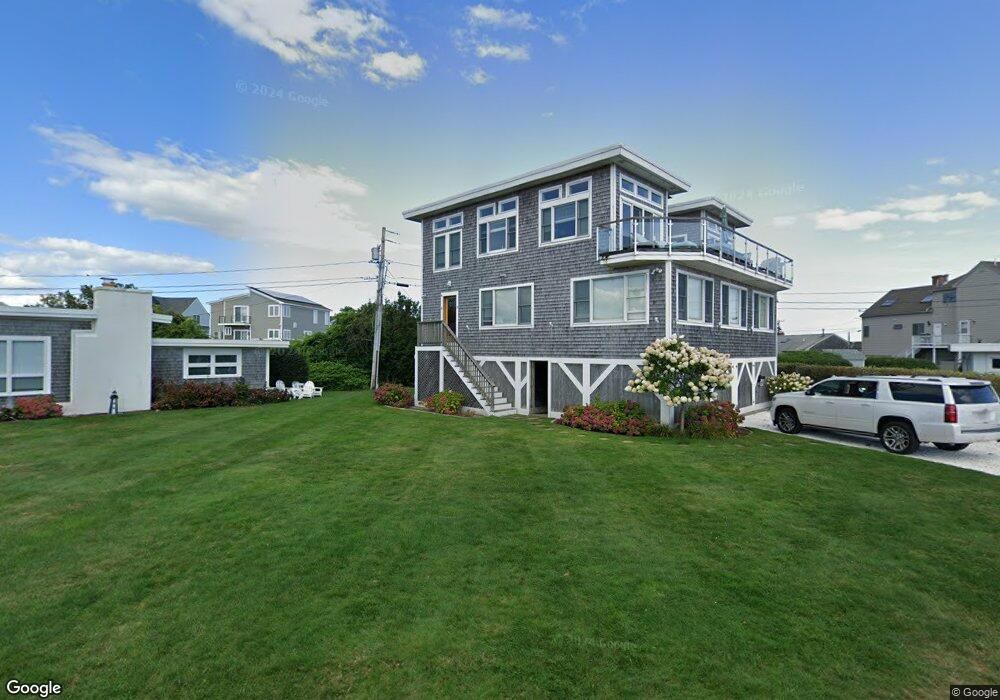
19 Bywater Ct Falmouth, MA 02540
Falmouth Village NeighborhoodEstimated Value: $1,715,000 - $1,983,000
3
Beds
2
Baths
1,001
Sq Ft
$1,825/Sq Ft
Est. Value
About This Home
This home is located at 19 Bywater Ct, Falmouth, MA 02540 and is currently estimated at $1,826,340, approximately $1,824 per square foot. 19 Bywater Ct is a home located in Barnstable County with nearby schools including Mullen-Hall School, Lawrence School, and Morse Pond School.
Ownership History
Date
Name
Owned For
Owner Type
Purchase Details
Closed on
Jan 25, 2007
Sold by
Walsh Bonnie R
Bought by
Walsh Bonnie R and Walsh Brian J
Current Estimated Value
Home Financials for this Owner
Home Financials are based on the most recent Mortgage that was taken out on this home.
Original Mortgage
$340,000
Outstanding Balance
$201,470
Interest Rate
6.15%
Mortgage Type
Purchase Money Mortgage
Estimated Equity
$1,624,870
Purchase Details
Closed on
May 10, 2004
Sold by
Kurtz Loretta M and Kurtz Norman R
Bought by
Walsh Bonnie R
Create a Home Valuation Report for This Property
The Home Valuation Report is an in-depth analysis detailing your home's value as well as a comparison with similar homes in the area
Home Values in the Area
Average Home Value in this Area
Purchase History
| Date | Buyer | Sale Price | Title Company |
|---|---|---|---|
| Walsh Bonnie R | -- | -- | |
| Walsh Bonnie R | -- | -- | |
| Walsh Bonnie R | $600,000 | -- | |
| Walsh Bonnie R | $600,000 | -- |
Source: Public Records
Mortgage History
| Date | Status | Borrower | Loan Amount |
|---|---|---|---|
| Open | Walsh Bonnie R | $340,000 | |
| Closed | Walsh Bonnie R | $340,000 |
Source: Public Records
Tax History Compared to Growth
Tax History
| Year | Tax Paid | Tax Assessment Tax Assessment Total Assessment is a certain percentage of the fair market value that is determined by local assessors to be the total taxable value of land and additions on the property. | Land | Improvement |
|---|---|---|---|---|
| 2025 | $8,193 | $1,395,700 | $692,700 | $703,000 |
| 2024 | $7,860 | $1,251,600 | $601,100 | $650,500 |
| 2023 | $7,633 | $1,103,100 | $601,100 | $502,000 |
| 2022 | $8,166 | $1,014,400 | $583,600 | $430,800 |
| 2021 | $7,885 | $927,600 | $535,000 | $392,600 |
| 2020 | $7,550 | $878,900 | $486,300 | $392,600 |
| 2019 | $7,494 | $875,500 | $486,300 | $389,200 |
| 2018 | $7,359 | $855,700 | $486,300 | $369,400 |
| 2017 | $7,234 | $848,100 | $486,300 | $361,800 |
| 2016 | $6,807 | $813,300 | $486,300 | $327,000 |
| 2015 | $6,661 | $813,300 | $486,300 | $327,000 |
| 2014 | $6,510 | $798,800 | $486,400 | $312,400 |
Source: Public Records
Map
Nearby Homes
- 15 Hedge Ln
- 65 Walker St
- 71 Main St
- 98 Main St
- 98 Main St Unit 1
- 253 Scranton Ave
- 480 Main St Unit 1
- 30 Katherine Lee Bates Rd
- 9 Fairmount Ave Unit 1
- 9 Fairmount Ave
- 33 Oakwood Ave
- 110 Dillingham Ave Unit 322
- 38 Landfall Unit 38
- 38 Landfall
- 286 Grand Ave Unit 6
- 286 Grand Ave Unit 8
- 286 Grand Ave Unit 4
- 87 Oyster Pond Rd
- 55 Jericho Path
- 22 Alma Rd