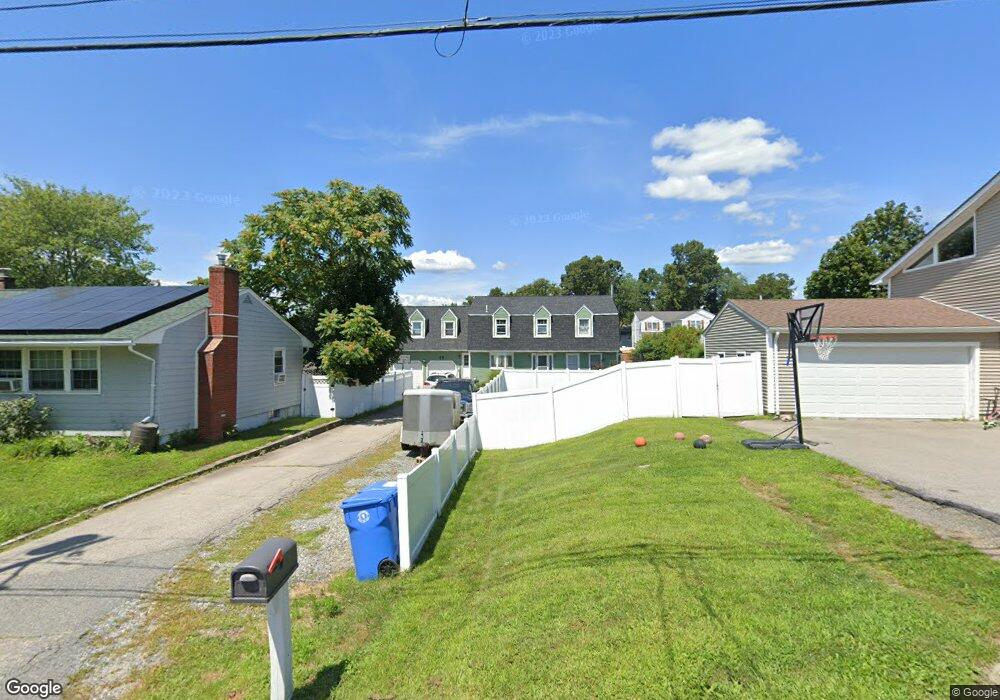
19 Camp St Cumberland, RI 02864
Cumberland Hill NeighborhoodEstimated Value: $499,000 - $669,000
4
Beds
2
Baths
2,560
Sq Ft
$220/Sq Ft
Est. Value
About This Home
This home is located at 19 Camp St, Cumberland, RI 02864 and is currently estimated at $563,531, approximately $220 per square foot. 19 Camp St is a home located in Providence County with nearby schools including John J. McLaughlin Cumberland Hill School, North Cumberland Middle School, and Cumberland High School.
Ownership History
Date
Name
Owned For
Owner Type
Purchase Details
Closed on
Jun 11, 2021
Sold by
Bisson Barbara A
Bought by
Faucher Shuane and Faucher Samantha
Current Estimated Value
Home Financials for this Owner
Home Financials are based on the most recent Mortgage that was taken out on this home.
Original Mortgage
$305,550
Outstanding Balance
$274,216
Interest Rate
2.9%
Mortgage Type
Purchase Money Mortgage
Estimated Equity
$289,315
Purchase Details
Closed on
Nov 9, 2006
Sold by
Bisson Rene D and Bisson Barbara A
Bought by
Bisson Barbara A
Create a Home Valuation Report for This Property
The Home Valuation Report is an in-depth analysis detailing your home's value as well as a comparison with similar homes in the area
Home Values in the Area
Average Home Value in this Area
Purchase History
| Date | Buyer | Sale Price | Title Company |
|---|---|---|---|
| Faucher Shuane | $315,000 | None Available | |
| Bisson Barbara A | -- | -- |
Source: Public Records
Mortgage History
| Date | Status | Borrower | Loan Amount |
|---|---|---|---|
| Open | Faucher Shuane | $305,550 | |
| Previous Owner | Bisson Barbara A | $131,355 | |
| Previous Owner | Bisson Barbara A | $35,000 | |
| Previous Owner | Bisson Barbara A | $100,000 | |
| Previous Owner | Bisson Barbara A | $81,000 |
Source: Public Records
Tax History
| Year | Tax Paid | Tax Assessment Tax Assessment Total Assessment is a certain percentage of the fair market value that is determined by local assessors to be the total taxable value of land and additions on the property. | Land | Improvement |
|---|---|---|---|---|
| 2025 | $6,068 | $494,500 | $147,000 | $347,500 |
| 2024 | $5,909 | $494,500 | $147,000 | $347,500 |
| 2023 | $5,790 | $498,300 | $147,000 | $351,300 |
| 2022 | $5,489 | $366,200 | $102,800 | $263,400 |
| 2021 | $5,398 | $366,200 | $102,800 | $263,400 |
| 2020 | $5,244 | $366,200 | $102,800 | $263,400 |
| 2019 | $5,083 | $320,100 | $85,800 | $234,300 |
| 2018 | $636 | $320,100 | $85,800 | $234,300 |
| 2017 | $4,869 | $320,100 | $85,800 | $234,300 |
| 2016 | $5,039 | $295,000 | $78,200 | $216,800 |
| 2015 | $5,039 | $295,000 | $78,200 | $216,800 |
| 2014 | $5,039 | $295,000 | $78,200 | $216,800 |
| 2013 | $4,755 | $301,300 | $77,900 | $223,400 |
Source: Public Records
Map
Nearby Homes
- 49 Poisson St
- 71 Branch Ave
- 45 Valley View Dr
- 3 Quail St
- 3889 Mendon Rd
- 252 Railroad St
- 106 Bouvier Ave
- 3 Lise Dr
- 1 Bouvier Ave
- 20 Mount Pleasant View Ave
- 172 Central St
- 200 Manville Hill Unit 41 Bldg B Rd Unit 41
- 131 New River Rd
- 10 Blue Mist Dr
- 141 Old Main St Unit B
- 5 Valley St
- 40 Heroux Blvd
- 39 Louise St
- 94 Kay St
- 54 Sulyma St
Your Personal Tour Guide
Ask me questions while you tour the home.