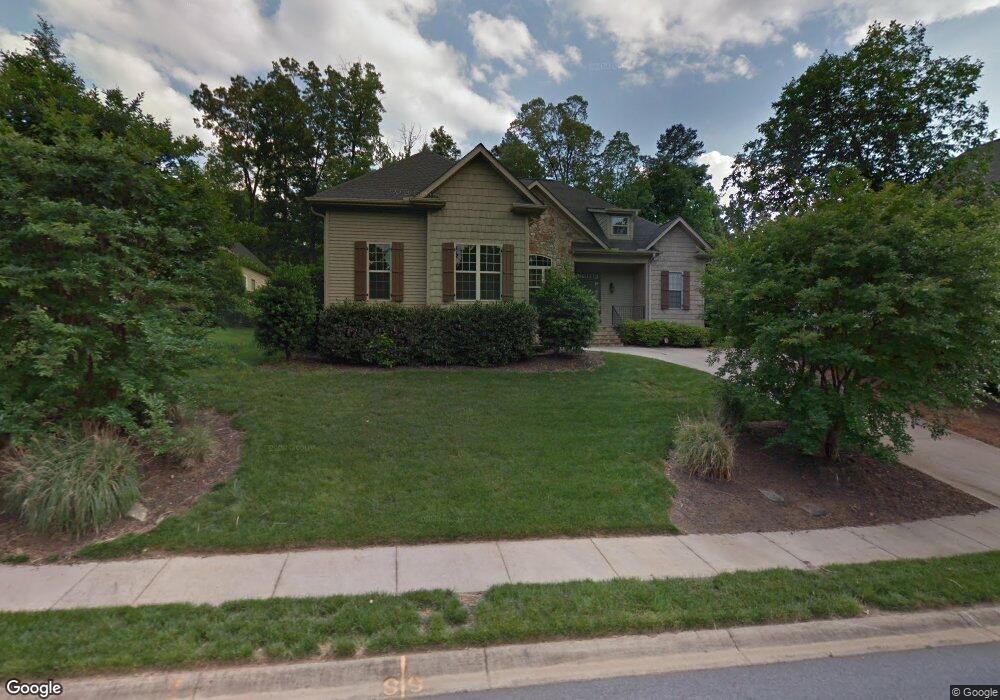
19 Carolina Oaks Dr Fountain Inn, SC 29644
Estimated Value: $449,821 - $505,000
3
Beds
3
Baths
2,397
Sq Ft
$201/Sq Ft
Est. Value
About This Home
This home is located at 19 Carolina Oaks Dr, Fountain Inn, SC 29644 and is currently estimated at $482,705, approximately $201 per square foot. 19 Carolina Oaks Dr is a home located in Greenville County with nearby schools including Ruldolph G. Gordon School at Jones Mill and Fountain Inn Christian School.
Ownership History
Date
Name
Owned For
Owner Type
Purchase Details
Closed on
Aug 8, 2016
Sold by
Hicklin Lona J
Bought by
Aycock Sandy K
Current Estimated Value
Home Financials for this Owner
Home Financials are based on the most recent Mortgage that was taken out on this home.
Original Mortgage
$230,000
Outstanding Balance
$183,097
Interest Rate
3.41%
Mortgage Type
New Conventional
Estimated Equity
$299,608
Purchase Details
Closed on
Jan 31, 2011
Sold by
J Francis Builders Llc
Bought by
Hicklin Lonna J
Home Financials for this Owner
Home Financials are based on the most recent Mortgage that was taken out on this home.
Original Mortgage
$199,920
Interest Rate
4.79%
Mortgage Type
New Conventional
Purchase Details
Closed on
Feb 1, 2006
Sold by
Tfl Properties Llc
Bought by
J Francis Builders Llc
Purchase Details
Closed on
Jan 31, 2006
Sold by
Tfl Properties Llc
Bought by
J Francis Builders Llc
Create a Home Valuation Report for This Property
The Home Valuation Report is an in-depth analysis detailing your home's value as well as a comparison with similar homes in the area
Home Values in the Area
Average Home Value in this Area
Purchase History
| Date | Buyer | Sale Price | Title Company |
|---|---|---|---|
| Aycock Sandy K | $270,000 | None Available | |
| Hicklin Lonna J | $249,900 | -- | |
| J Francis Builders Llc | $99,750 | -- | |
| J Francis Builders Llc | $99,750 | None Available |
Source: Public Records
Mortgage History
| Date | Status | Borrower | Loan Amount |
|---|---|---|---|
| Open | Aycock Sandy K | $230,000 | |
| Previous Owner | Hicklin Lonna J | $199,920 |
Source: Public Records
Tax History Compared to Growth
Tax History
| Year | Tax Paid | Tax Assessment Tax Assessment Total Assessment is a certain percentage of the fair market value that is determined by local assessors to be the total taxable value of land and additions on the property. | Land | Improvement |
|---|---|---|---|---|
| 2024 | $1,719 | $10,970 | $1,720 | $9,250 |
| 2023 | $1,719 | $10,970 | $1,720 | $9,250 |
| 2022 | $1,676 | $10,970 | $1,720 | $9,250 |
| 2021 | $1,661 | $10,970 | $1,720 | $9,250 |
| 2020 | $1,632 | $10,360 | $1,600 | $8,760 |
| 2019 | $1,648 | $10,360 | $1,600 | $8,760 |
| 2018 | $1,760 | $10,360 | $1,600 | $8,760 |
| 2017 | $4,767 | $15,540 | $2,400 | $13,140 |
| 2016 | $1,702 | $259,080 | $40,000 | $219,080 |
| 2015 | $1,692 | $259,080 | $40,000 | $219,080 |
| 2014 | $1,844 | $290,070 | $40,000 | $250,070 |
Source: Public Records
Map
Nearby Homes
- 25 Trailwood Dr
- 1661 Scuffletown Rd
- 432 Galleron Ct
- 416 Galleron Ct
- 525 Tallman Dr
- Furman Plan at Parklynn Hills
- Fielder Plan at Parklynn Hills
- Lansford Plan at Parklynn Hills
- Oaklyn Plan at Parklynn Hills
- Evans South Plan at Parklynn Hills
- Bowman Plan at Parklynn Hills
- 140 Coppa Ct
- 1613 Scuffletown Rd
- 1610 Scuffletown Rd
- 141 N Heron Dr
- 308 Braxton Meadow Dr
- 19 Kendals Ln
- 102 Sagewood Ct
- 36 Heritage Dr
- 628 Hellams St
- 15 Carolina Oaks Dr
- 23 Carolina Oaks Dr
- 27 Carolina Oaks Dr
- 20 Carolina Oaks Dr
- 16 Carolina Oaks Dr
- 31 Carolina Oaks Dr
- 24 Carolina Oaks Dr
- 12 Carolina Oaks Dr
- 28 Carolina Oaks Dr
- 8 Carolina Oaks Dr
- 33 Carolina Oaks Dr
- 32 Carolina Oaks Dr
- 35 Carolina Oaks Dr
- 175 Carolina Way
- 36 Carolina Oaks Dr
- 9 Crest Hill Dr
- 5 Crest Hill Dr
- 42 Carolina Oaks Dr
- 15 Crest Hill Dr Unit 13
- 15 Crest Hill Dr