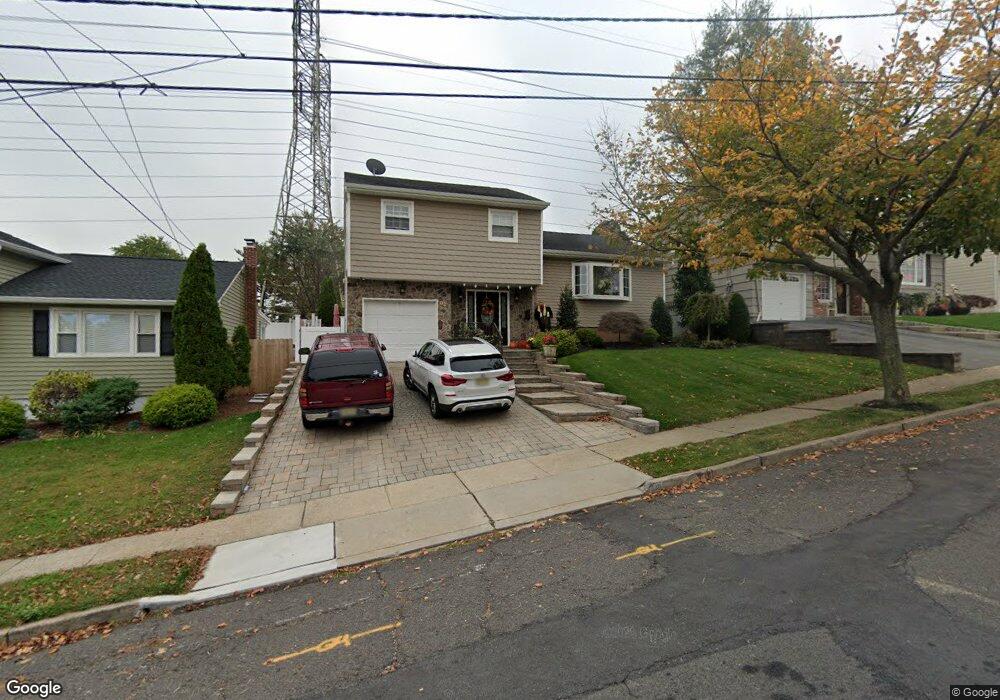
19 Carrie Ct Nutley, NJ 07110
Estimated Value: $496,000 - $651,000
Studio
--
Bath
1,487
Sq Ft
$405/Sq Ft
Est. Value
About This Home
This home is located at 19 Carrie Ct, Nutley, NJ 07110 and is currently estimated at $601,741, approximately $404 per square foot. 19 Carrie Ct is a home located in Essex County with nearby schools including Nutley High School, Maarif School, and Good Shepherd Academy.
Ownership History
Date
Name
Owned For
Owner Type
Purchase Details
Closed on
Apr 5, 2004
Sold by
Bocanegra Omayra
Bought by
Salinas Enrique
Current Estimated Value
Home Financials for this Owner
Home Financials are based on the most recent Mortgage that was taken out on this home.
Original Mortgage
$235,125
Outstanding Balance
$110,184
Interest Rate
5.6%
Estimated Equity
$491,557
Purchase Details
Closed on
Aug 29, 2001
Sold by
Patel Manilal
Bought by
Bocanegra Omayra
Home Financials for this Owner
Home Financials are based on the most recent Mortgage that was taken out on this home.
Original Mortgage
$240,101
Interest Rate
7.05%
Mortgage Type
FHA
Create a Home Valuation Report for This Property
The Home Valuation Report is an in-depth analysis detailing your home's value as well as a comparison with similar homes in the area
Home Values in the Area
Average Home Value in this Area
Purchase History
| Date | Buyer | Sale Price | Title Company |
|---|---|---|---|
| Salinas Enrique | $247,500 | -- | |
| Bocanegra Omayra | $242,000 | -- |
Source: Public Records
Mortgage History
| Date | Status | Borrower | Loan Amount |
|---|---|---|---|
| Open | Salinas Enrique | $235,125 | |
| Previous Owner | Bocanegra Omayra | $240,101 |
Source: Public Records
Tax History
| Year | Tax Paid | Tax Assessment Tax Assessment Total Assessment is a certain percentage of the fair market value that is determined by local assessors to be the total taxable value of land and additions on the property. | Land | Improvement |
|---|---|---|---|---|
| 2025 | $12,184 | $462,900 | $243,500 | $219,400 |
| 2024 | $11,924 | $462,900 | $243,500 | $219,400 |
| 2022 | $12,114 | $313,500 | $162,500 | $151,000 |
| 2021 | $12,051 | $313,500 | $162,500 | $151,000 |
| 2020 | $11,543 | $313,500 | $162,500 | $151,000 |
| 2019 | $11,311 | $313,500 | $162,500 | $151,000 |
| 2018 | $11,007 | $313,500 | $162,500 | $151,000 |
| 2017 | $10,888 | $313,500 | $162,500 | $151,000 |
| 2016 | $10,565 | $313,500 | $162,500 | $151,000 |
| 2015 | $10,396 | $313,500 | $162,500 | $151,000 |
| 2014 | $10,264 | $313,500 | $162,500 | $151,000 |
Source: Public Records
Map
Nearby Homes
Your Personal Tour Guide
Ask me questions while you tour the home.