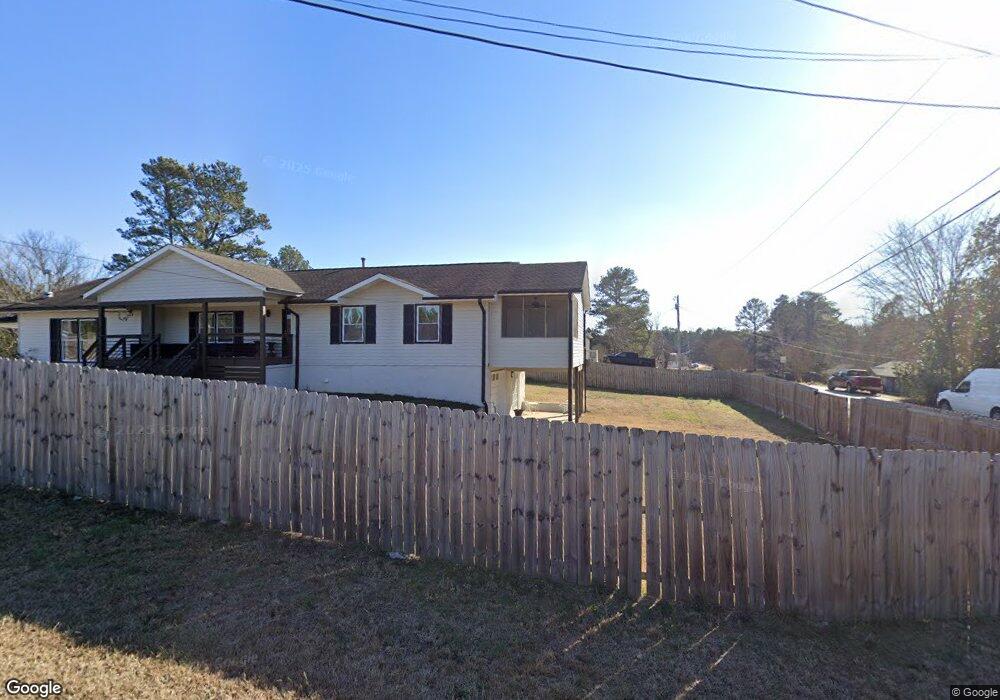
19 Cedarcrest Dr Unit VILLAGE Acworth, GA 30101
Cedarcrest NeighborhoodEstimated Value: $468,909 - $547,000
3
Beds
3
Baths
2,374
Sq Ft
$213/Sq Ft
Est. Value
About This Home
This home is located at 19 Cedarcrest Dr Unit VILLAGE, Acworth, GA 30101 and is currently estimated at $504,977, approximately $212 per square foot. 19 Cedarcrest Dr Unit VILLAGE is a home located in Paulding County with nearby schools including Floyd L. Shelton Elementary School at Crossroad, Sammy Mcclure Sr. Middle School, and North Paulding High School.
Ownership History
Date
Name
Owned For
Owner Type
Purchase Details
Closed on
Sep 30, 2015
Sold by
Stonehaven Capital Llc
Bought by
Barnum Usher Lee and Barnum Lizetora
Current Estimated Value
Home Financials for this Owner
Home Financials are based on the most recent Mortgage that was taken out on this home.
Original Mortgage
$174,700
Outstanding Balance
$137,685
Interest Rate
3.93%
Mortgage Type
New Conventional
Estimated Equity
$367,292
Purchase Details
Closed on
Aug 5, 2015
Sold by
Thomas Homes & Communities Llc
Bought by
Stonehaven Capital Llc
Home Financials for this Owner
Home Financials are based on the most recent Mortgage that was taken out on this home.
Original Mortgage
$174,700
Outstanding Balance
$137,685
Interest Rate
3.93%
Mortgage Type
New Conventional
Estimated Equity
$367,292
Create a Home Valuation Report for This Property
The Home Valuation Report is an in-depth analysis detailing your home's value as well as a comparison with similar homes in the area
Home Values in the Area
Average Home Value in this Area
Purchase History
| Date | Buyer | Sale Price | Title Company |
|---|---|---|---|
| Barnum Usher Lee | $302,500 | -- | |
| Stonehaven Capital Llc | $328,000 | -- |
Source: Public Records
Mortgage History
| Date | Status | Borrower | Loan Amount |
|---|---|---|---|
| Open | Barnum Usher Lee | $174,700 |
Source: Public Records
Tax History Compared to Growth
Tax History
| Year | Tax Paid | Tax Assessment Tax Assessment Total Assessment is a certain percentage of the fair market value that is determined by local assessors to be the total taxable value of land and additions on the property. | Land | Improvement |
|---|---|---|---|---|
| 2024 | $1,241 | $180,872 | $26,000 | $154,872 |
| 2023 | $1,313 | $163,784 | $26,000 | $137,784 |
| 2022 | $1,071 | $132,696 | $26,000 | $106,696 |
| 2021 | $1,207 | $121,092 | $26,000 | $95,092 |
| 2020 | $1,181 | $111,824 | $26,000 | $85,824 |
| 2019 | $1,283 | $116,760 | $26,000 | $90,760 |
| 2018 | $1,298 | $119,360 | $26,000 | $93,360 |
| 2017 | $1,249 | $111,000 | $26,000 | $85,000 |
| 2016 | $1,329 | $125,120 | $26,000 | $99,120 |
| 2015 | $1,901 | $61,760 | $15,000 | $46,760 |
Source: Public Records
Map
Nearby Homes
- 39 Telfair Ct
- 64 Telfair Ct
- 71 Vandiver Ct
- 28 Vandiver Ct
- 138 Highcrest Dr
- 254 Broadstone Blvd
- 954 Carl Sanders Dr
- 261 Highcrest Dr
- 6205 Arnall Ct NW
- 6335 Howell Cobb Ct
- 6206 Cedarcrest Rd NW
- 6323 Howell Cobb Ct
- 1022 Carl Sanders Dr
- 300 Carl Sanders Dr
- 681 Carl Sanders Dr
- 123 Candler Loop
- 6191 Talmadge Run NW
- 6186 Talmadge Run NW
- 17 Cedarcrest Dr
- 11 Cedarcrest Dr
- 59 Cedarcrest Dr
- 26 Cedarcrest Dr Unit 27
- 61 Cedarcrest Dr
- 63 Cedarcrest Dr Unit COURT
- 63 Cedarcrest Dr Unit CT
- 63 Cedarcrest Dr
- 0000 Cedarcrest Dr
- 0 Cedarcrest Dr
- 0 Cedarcrest Dr Unit 7494534
- 0 Cedarcrest Dr Unit 7055807
- 0 Cedarcrest Dr Unit 8024761
- 0 Cedarcrest Dr Unit 8063268
- 0 Cedarcrest Dr Unit 2912073
- 42 Cedarcrest Dr Unit 60
- 77 Cedarcrest Dr
- 97 Cedarcrest Dr
- 89 Cedarcrest Dr
- 60 Cedarcrest Dr Unit 58