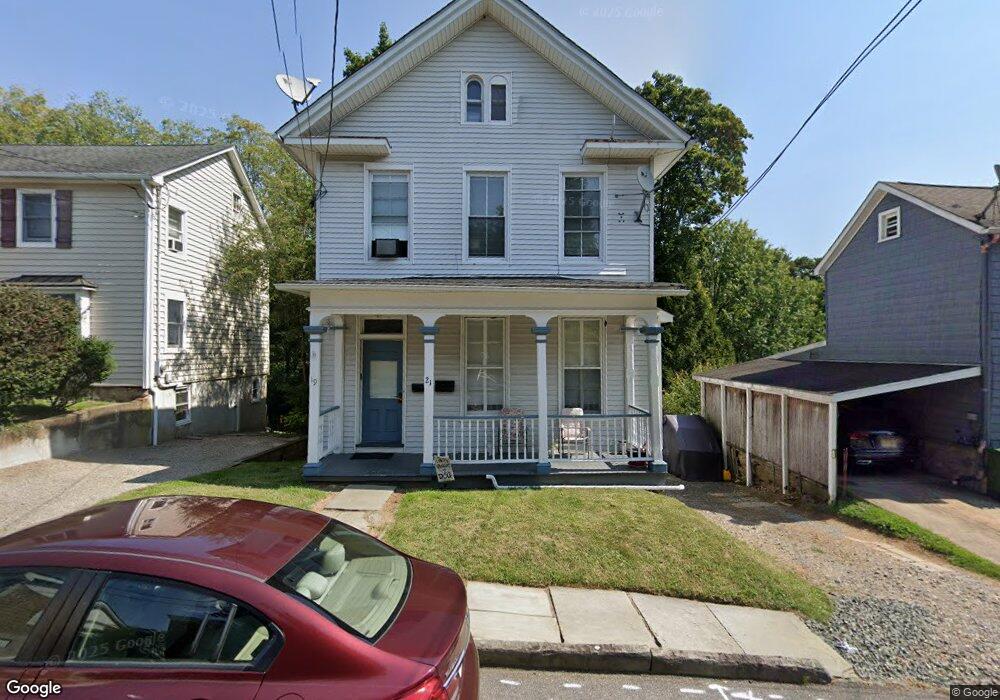
19 Center St Unit 21 High Bridge, NJ 08829
Estimated Value: $297,000
3
Beds
2
Baths
1,558
Sq Ft
$191/Sq Ft
Est. Value
About This Home
This home is located at 19 Center St Unit 21, High Bridge, NJ 08829 and is currently estimated at $297,000, approximately $190 per square foot. 19 Center St Unit 21 is a home located in Hunterdon County with nearby schools including High Bridge Elementary School, High Bridge Middle School, and Voorhees High School.
Ownership History
Date
Name
Owned For
Owner Type
Purchase Details
Closed on
Dec 14, 2017
Sold by
Burd Kim W and Burd Shirely A
Bought by
Rispoli James and Rispoli Regina
Current Estimated Value
Purchase Details
Closed on
Oct 9, 1996
Sold by
Goceljak George and Adams Edward
Bought by
Eberle Wayne and Eberle Ronald
Home Financials for this Owner
Home Financials are based on the most recent Mortgage that was taken out on this home.
Original Mortgage
$66,500
Interest Rate
8.26%
Create a Home Valuation Report for This Property
The Home Valuation Report is an in-depth analysis detailing your home's value as well as a comparison with similar homes in the area
Home Values in the Area
Average Home Value in this Area
Purchase History
| Date | Buyer | Sale Price | Title Company |
|---|---|---|---|
| Rispoli James | $150,000 | Nrt Title Agency Llc | |
| Eberle Wayne | $95,000 | -- |
Source: Public Records
Mortgage History
| Date | Status | Borrower | Loan Amount |
|---|---|---|---|
| Previous Owner | Eberle Wayne | $66,500 |
Source: Public Records
Tax History Compared to Growth
Tax History
| Year | Tax Paid | Tax Assessment Tax Assessment Total Assessment is a certain percentage of the fair market value that is determined by local assessors to be the total taxable value of land and additions on the property. | Land | Improvement |
|---|---|---|---|---|
| 2025 | $9,665 | $279,100 | $93,900 | $185,200 |
| 2024 | $9,260 | $296,100 | $87,000 | $209,100 |
| 2023 | $9,260 | $234,200 | $79,300 | $154,900 |
| 2022 | $7,446 | $175,000 | $69,300 | $105,700 |
| 2021 | $7,308 | $171,000 | $69,300 | $101,700 |
| 2020 | $7,216 | $176,000 | $69,300 | $106,700 |
| 2019 | $7,308 | $176,900 | $69,300 | $107,600 |
| 2018 | $8,837 | $223,000 | $69,300 | $153,700 |
| 2017 | $8,833 | $229,200 | $72,800 | $156,400 |
| 2016 | $8,730 | $229,200 | $72,800 | $156,400 |
| 2015 | $8,494 | $229,200 | $72,800 | $156,400 |
| 2014 | $7,345 | $214,200 | $92,200 | $122,000 |
Source: Public Records
Map
Nearby Homes