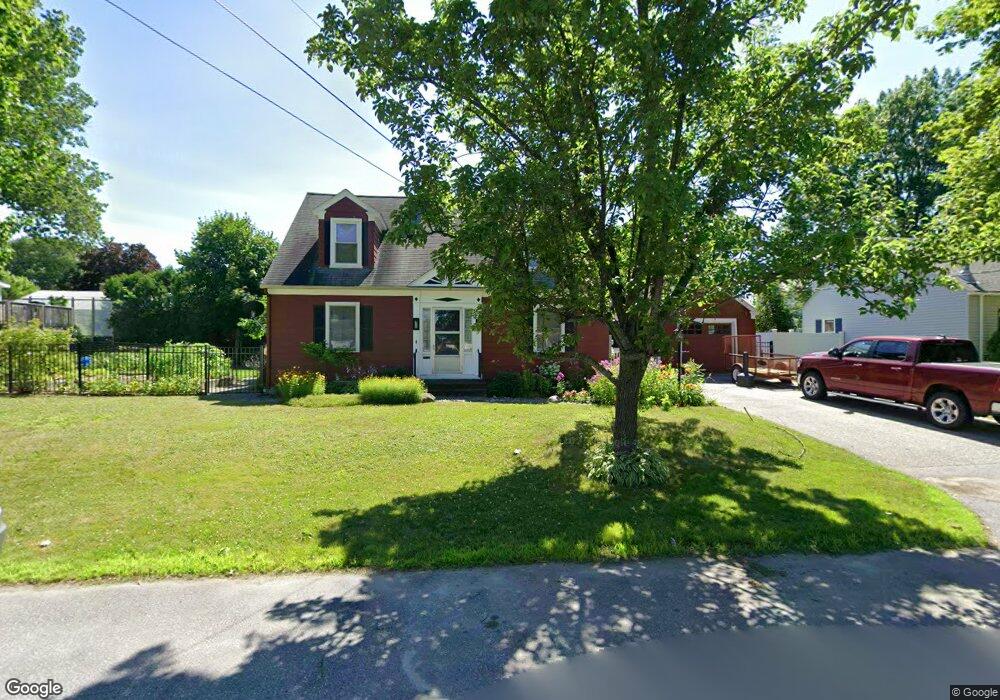
19 Charles St Lewiston, ME 04240
Estimated Value: $339,000 - $387,000
3
Beds
2
Baths
2,214
Sq Ft
$164/Sq Ft
Est. Value
About This Home
This home is located at 19 Charles St, Lewiston, ME 04240 and is currently estimated at $362,775, approximately $163 per square foot. 19 Charles St is a home located in Androscoggin County with nearby schools including Farwell Elementary School, Lewiston High School, and The Discovery School.
Ownership History
Date
Name
Owned For
Owner Type
Purchase Details
Closed on
Sep 26, 2007
Sold by
Favaloro John R
Bought by
Almquist Christopher S and Almquist Elizabeth J
Current Estimated Value
Home Financials for this Owner
Home Financials are based on the most recent Mortgage that was taken out on this home.
Original Mortgage
$148,000
Outstanding Balance
$93,658
Interest Rate
6.65%
Mortgage Type
Unknown
Estimated Equity
$269,117
Create a Home Valuation Report for This Property
The Home Valuation Report is an in-depth analysis detailing your home's value as well as a comparison with similar homes in the area
Home Values in the Area
Average Home Value in this Area
Purchase History
| Date | Buyer | Sale Price | Title Company |
|---|---|---|---|
| Almquist Christopher S | -- | -- |
Source: Public Records
Mortgage History
| Date | Status | Borrower | Loan Amount |
|---|---|---|---|
| Open | Almquist Christopher S | $148,000 | |
| Closed | Almquist Christopher S | $37,000 |
Source: Public Records
Tax History Compared to Growth
Tax History
| Year | Tax Paid | Tax Assessment Tax Assessment Total Assessment is a certain percentage of the fair market value that is determined by local assessors to be the total taxable value of land and additions on the property. | Land | Improvement |
|---|---|---|---|---|
| 2025 | $3,917 | $119,490 | $24,840 | $94,650 |
| 2024 | $3,606 | $113,490 | $24,840 | $88,650 |
| 2023 | $3,405 | $113,490 | $24,840 | $88,650 |
| 2022 | $3,234 | $113,490 | $24,840 | $88,650 |
| 2021 | $3,207 | $113,490 | $24,840 | $88,650 |
| 2020 | $3,254 | $113,490 | $24,840 | $88,650 |
| 2019 | $3,281 | $113,490 | $24,840 | $88,650 |
| 2018 | $3,254 | $113,490 | $24,840 | $88,650 |
| 2017 | $3,180 | $113,490 | $24,840 | $88,650 |
| 2016 | $3,126 | $113,490 | $24,840 | $88,650 |
| 2015 | $3,106 | $113,490 | $24,840 | $88,650 |
| 2014 | $2,939 | $110,520 | $24,840 | $85,680 |
| 2013 | $2,922 | $110,520 | $24,840 | $85,680 |
Source: Public Records
Map
Nearby Homes