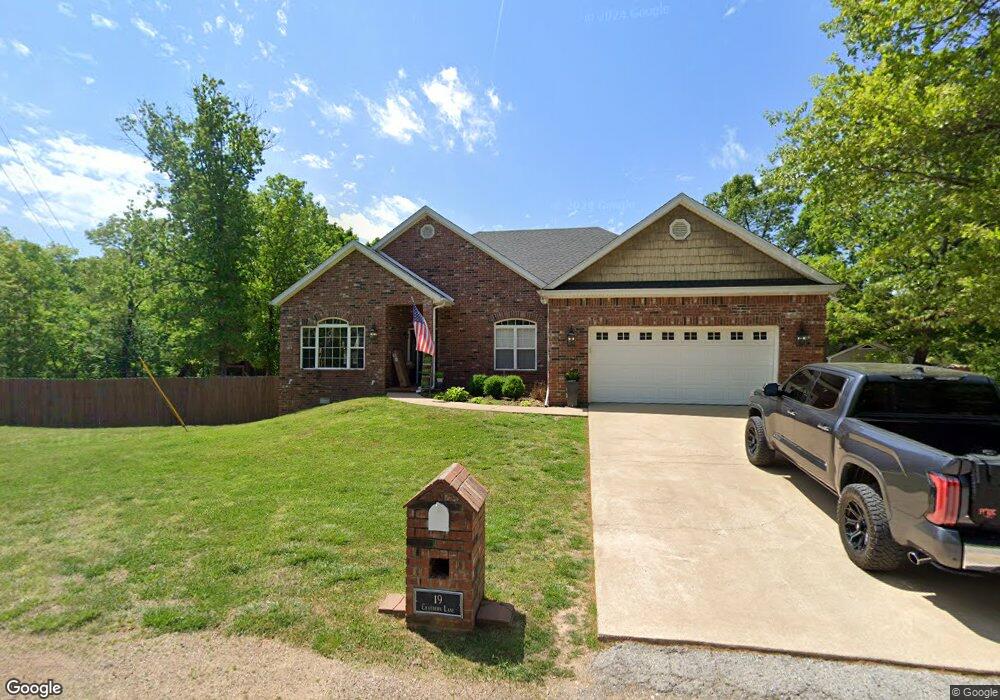
19 Chatburn Ln Bella Vista, AR 72715
Estimated Value: $490,000 - $675,000
4
Beds
2
Baths
2,993
Sq Ft
$188/Sq Ft
Est. Value
About This Home
This home is located at 19 Chatburn Ln, Bella Vista, AR 72715 and is currently estimated at $563,720, approximately $188 per square foot. 19 Chatburn Ln is a home located in Benton County with nearby schools including Thomas Jefferson Elementary School, Lincoln Junior High School, and Old High Middle School.
Ownership History
Date
Name
Owned For
Owner Type
Purchase Details
Closed on
Jun 23, 2010
Sold by
Federal National Mortgage Association
Bought by
Son Michael and Son Dawn
Current Estimated Value
Home Financials for this Owner
Home Financials are based on the most recent Mortgage that was taken out on this home.
Original Mortgage
$174,503
Interest Rate
4.77%
Mortgage Type
New Conventional
Purchase Details
Closed on
Dec 7, 2009
Sold by
Mcneilly M Scott and Mcneilly Sonya S
Bought by
Federal National Mortgage Association
Purchase Details
Closed on
Dec 2, 2003
Bought by
Mcneilly
Purchase Details
Closed on
Jul 22, 2003
Bought by
S
Purchase Details
Closed on
Jul 9, 1981
Bought by
Grant
Purchase Details
Closed on
Jul 22, 1980
Bought by
Tisdale
Create a Home Valuation Report for This Property
The Home Valuation Report is an in-depth analysis detailing your home's value as well as a comparison with similar homes in the area
Home Values in the Area
Average Home Value in this Area
Purchase History
| Date | Buyer | Sale Price | Title Company |
|---|---|---|---|
| Son Michael | -- | None Available | |
| Federal National Mortgage Association | $222,158 | None Available | |
| Mcneilly | $203,000 | -- | |
| S | $3,000 | -- | |
| Grant | $6,000 | -- | |
| Tisdale | $6,000 | -- |
Source: Public Records
Mortgage History
| Date | Status | Borrower | Loan Amount |
|---|---|---|---|
| Previous Owner | Son Michael | $174,503 |
Source: Public Records
Tax History Compared to Growth
Tax History
| Year | Tax Paid | Tax Assessment Tax Assessment Total Assessment is a certain percentage of the fair market value that is determined by local assessors to be the total taxable value of land and additions on the property. | Land | Improvement |
|---|---|---|---|---|
| 2025 | $3,300 | $88,449 | $1,600 | $86,849 |
| 2024 | $3,118 | $88,449 | $1,600 | $86,849 |
| 2023 | $2,970 | $58,700 | $800 | $57,900 |
| 2022 | $2,557 | $58,700 | $800 | $57,900 |
| 2021 | $2,417 | $58,700 | $800 | $57,900 |
| 2020 | $2,308 | $42,120 | $600 | $41,520 |
| 2019 | $2,308 | $42,120 | $600 | $41,520 |
| 2018 | $2,333 | $42,120 | $600 | $41,520 |
| 2017 | $2,227 | $42,120 | $600 | $41,520 |
| 2016 | $2,227 | $42,120 | $600 | $41,520 |
| 2015 | $2,414 | $40,040 | $1,000 | $39,040 |
| 2014 | $2,064 | $40,040 | $1,000 | $39,040 |
Source: Public Records
Map
Nearby Homes
- 0 Boxford Dr
- 20 Stanton Cir
- 52 Chatburn Dr
- Lot 6 Prescot Rd
- 15 Grinstead Ln
- 46 W Elvendon Dr
- 6 Bracknell Ln
- 41 Annabell Ln
- Lot 3 of Block 3 Queensborough Dr
- 49 Clevelys Ln
- 6 Cunningham Dr
- 61 London Dr
- 2 Portland Ln
- Lot 1 of Block 3 London Dr
- 14 Runnymede Ln
- 18 Hamilton Dr
- Lot 22 of Block 2 Burbage Ln
- 0 Anthony Ln Unit 1311811
- 12 Claypole Ln
- 3 Pylle Ln
- Lot 27 Bembridge Ln
- 27 Bembridge Ln
- 1 Bembridge Ln
- 15 Chatburn Ln
- L7 B5 Bembridge Ln
- Lot 13 Chatburn Ln
- 2 Bembridge Ln
- - Bembridge Ln
- ` Bembridge Ln
- 13 Chatburn Ln
- 13 Chatburn Ln
- Lot 7 Chatburn Ln
- 4 Bembridge Ln
- L18 Chatburn Ln
- Lot 18 Chatburn Ln
- 6 Linfield Ln
- 6 Linfield Ln
- Lot 7 Block 6 Lindfield Ln
- 10 Linfield Ln
- Lot 12, Block 4 Chatburn Ln