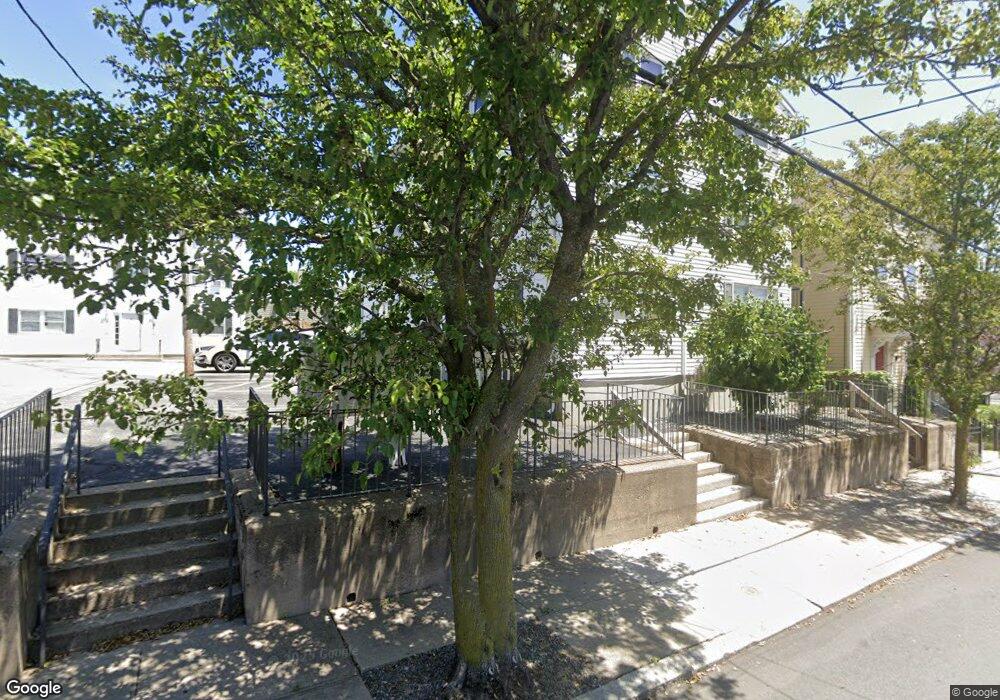
19 Cherry St Unit 1 Pawtucket, RI 02860
Downtown Pawtucket NeighborhoodEstimated Value: $128,000 - $244,000
2
Beds
1
Bath
838
Sq Ft
$232/Sq Ft
Est. Value
About This Home
This home is located at 19 Cherry St Unit 1, Pawtucket, RI 02860 and is currently estimated at $194,671, approximately $232 per square foot. 19 Cherry St Unit 1 is a home located in Providence County with nearby schools including Blackstone Valley Prep Junior High School and Saint Raphael Academy.
Ownership History
Date
Name
Owned For
Owner Type
Purchase Details
Closed on
Feb 1, 2022
Sold by
Oshinkanlu Feyishayo I
Bought by
Walter King Ent Llc
Current Estimated Value
Home Financials for this Owner
Home Financials are based on the most recent Mortgage that was taken out on this home.
Original Mortgage
$80,000
Outstanding Balance
$73,473
Interest Rate
3.45%
Mortgage Type
Purchase Money Mortgage
Estimated Equity
$121,198
Purchase Details
Closed on
Aug 28, 2015
Sold by
Allard Jason M and Allard Kristin N
Bought by
Oshinkanlu Feyishayo I
Purchase Details
Closed on
Apr 23, 2014
Sold by
Provident Properties L
Bought by
Allard Jason M and Allard Kristin N
Purchase Details
Closed on
Oct 19, 2012
Sold by
Allard Jason M and Allard Kristin N
Bought by
Provident Props Llc
Purchase Details
Closed on
Jun 4, 2010
Sold by
Deutsche Bank Natl T C
Bought by
Allard Jason M and Allard Kristin N
Purchase Details
Closed on
Jan 25, 2010
Sold by
Melgar William
Bought by
Deutsche Bk
Create a Home Valuation Report for This Property
The Home Valuation Report is an in-depth analysis detailing your home's value as well as a comparison with similar homes in the area
Home Values in the Area
Average Home Value in this Area
Purchase History
| Date | Buyer | Sale Price | Title Company |
|---|---|---|---|
| Walter King Ent Llc | $100,000 | None Available | |
| Oshinkanlu Feyishayo I | $36,000 | -- | |
| Allard Jason M | -- | -- | |
| Allard Jason M | -- | -- | |
| Provident Props Llc | -- | -- | |
| Allard Jason M | $36,000 | -- | |
| Deutsche Bk | $45,000 | -- |
Source: Public Records
Mortgage History
| Date | Status | Borrower | Loan Amount |
|---|---|---|---|
| Open | Walter King Ent Llc | $80,000 |
Source: Public Records
Tax History
| Year | Tax Paid | Tax Assessment Tax Assessment Total Assessment is a certain percentage of the fair market value that is determined by local assessors to be the total taxable value of land and additions on the property. | Land | Improvement |
|---|---|---|---|---|
| 2025 | $1,212 | $92,200 | $0 | $92,200 |
| 2024 | $1,138 | $92,200 | $0 | $92,200 |
| 2023 | $1,050 | $62,000 | $0 | $62,000 |
| 2022 | $1,028 | $62,000 | $0 | $62,000 |
| 2021 | $1,028 | $62,000 | $0 | $62,000 |
| 2020 | $1,038 | $49,700 | $0 | $49,700 |
| 2019 | $1,038 | $49,700 | $0 | $49,700 |
| 2018 | $1,000 | $49,700 | $0 | $49,700 |
| 2017 | $1,070 | $47,100 | $0 | $47,100 |
| 2016 | $1,031 | $47,100 | $0 | $47,100 |
| 2015 | $1,031 | $47,100 | $0 | $47,100 |
| 2014 | $1,852 | $80,300 | $0 | $80,300 |
Source: Public Records
Map
Nearby Homes
- 78 Barton St
- 140 Dexter St
- 234 Central St Unit 236
- 218 Central St
- 256 High St
- 28 Bayley St Unit 107
- 396 Roosevelt Ave
- 517 High St
- 511 High St
- 17 Beecher St
- 722 Dexter St Unit 726
- 14 Martin Ct
- 7 Fales St
- 27 Lloyd St
- 616 Lonsdale Ave Unit 618
- 546 Lonsdale Ave Unit 548
- 30 Foundry St Unit 6
- 48 Star St
- 66 Perry St
- 45 Harrison St
- 19 Cherry St Unit 2
- 19 Cherry St Unit 3
- 19 Cherry St Unit 5
- 19 Cherry St Unit 7
- 19 Cherry St Unit 6
- 19 Cherry St Unit 4
- 19 Cherry St
- 19 Cherry St Unit 19
- 21 Cherry St Unit 13
- 21 Cherry St Unit 12
- 21 Cherry St Unit 11
- 21 Cherry St Unit 10
- 21 Cherry St Unit 9
- 21 Cherry St Unit 8
- 21 Cherry St
- 17 Cherry St
- 23 Cherry St Unit 19
- 23 Cherry St Unit 18
- 23 Cherry St Unit 17
- 23 Cherry St Unit 16
Your Personal Tour Guide
Ask me questions while you tour the home.