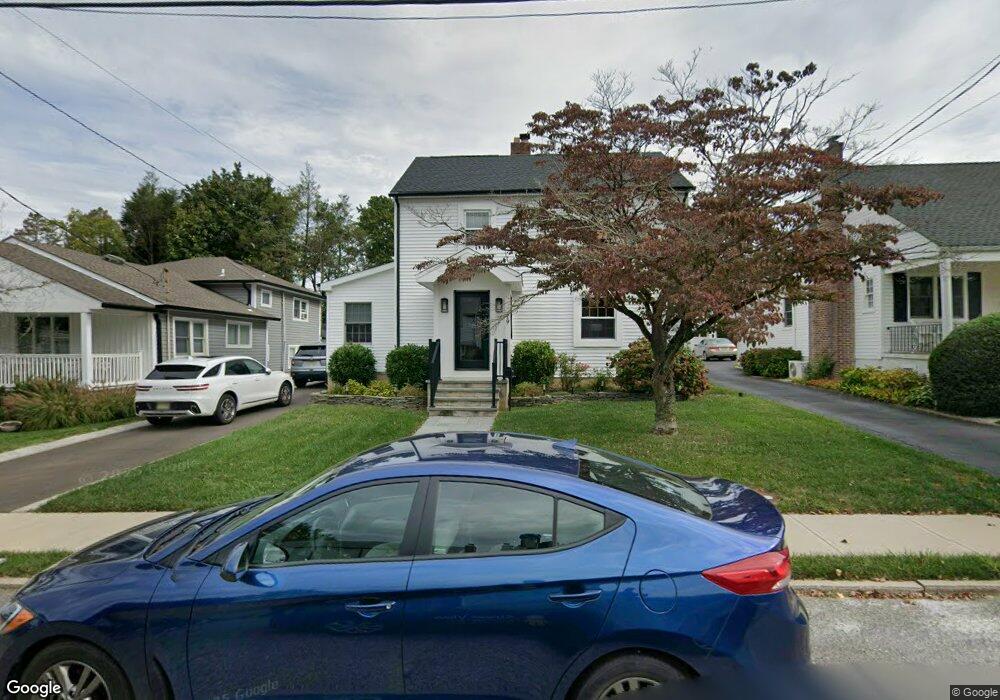
19 Chestnut Place West Long Branch, NJ 07764
Estimated Value: $778,000 - $958,000
2
Beds
2
Baths
2,867
Sq Ft
$311/Sq Ft
Est. Value
About This Home
This home is located at 19 Chestnut Place, West Long Branch, NJ 07764 and is currently estimated at $890,604, approximately $310 per square foot. 19 Chestnut Place is a home located in Monmouth County with nearby schools including Betty McElmon Elementary School, Frank Antonides School, and Shore Regional High School.
Ownership History
Date
Name
Owned For
Owner Type
Purchase Details
Closed on
Dec 22, 2020
Sold by
Cannan Stacy M
Bought by
Cannan Stacy M and Brennan Kevin P
Current Estimated Value
Home Financials for this Owner
Home Financials are based on the most recent Mortgage that was taken out on this home.
Original Mortgage
$300,000
Interest Rate
2.6%
Mortgage Type
New Conventional
Purchase Details
Closed on
Dec 11, 2000
Sold by
Stoddard Christopher
Bought by
Cannan Stacy
Home Financials for this Owner
Home Financials are based on the most recent Mortgage that was taken out on this home.
Original Mortgage
$204,300
Interest Rate
7.7%
Purchase Details
Closed on
Oct 28, 1997
Sold by
Cordner Lee
Bought by
Stoddard Christopher and Stoddard Maryellen
Home Financials for this Owner
Home Financials are based on the most recent Mortgage that was taken out on this home.
Original Mortgage
$112,000
Interest Rate
7.23%
Create a Home Valuation Report for This Property
The Home Valuation Report is an in-depth analysis detailing your home's value as well as a comparison with similar homes in the area
Home Values in the Area
Average Home Value in this Area
Purchase History
| Date | Buyer | Sale Price | Title Company |
|---|---|---|---|
| Cannan Stacy M | -- | Title365 | |
| Cannan Stacy M | -- | None Listed On Document | |
| Cannan Stacy | $227,000 | -- | |
| Stoddard Christopher | $139,900 | -- |
Source: Public Records
Mortgage History
| Date | Status | Borrower | Loan Amount |
|---|---|---|---|
| Previous Owner | Cannan Stacy M | $300,000 | |
| Previous Owner | Cannan Stacy | $204,300 | |
| Previous Owner | Stoddard Christopher | $112,000 |
Source: Public Records
Tax History Compared to Growth
Tax History
| Year | Tax Paid | Tax Assessment Tax Assessment Total Assessment is a certain percentage of the fair market value that is determined by local assessors to be the total taxable value of land and additions on the property. | Land | Improvement |
|---|---|---|---|---|
| 2025 | $10,436 | $848,400 | $319,800 | $528,600 |
| 2024 | $11,433 | $800,900 | $294,000 | $506,900 |
| 2023 | $11,433 | $818,400 | $323,300 | $495,100 |
| 2022 | $7,850 | $672,700 | $273,300 | $399,400 |
| 2021 | $7,850 | $406,100 | $189,000 | $217,100 |
| 2020 | $8,043 | $391,400 | $179,300 | $212,100 |
| 2019 | $8,023 | $392,500 | $181,600 | $210,900 |
| 2018 | $7,969 | $376,600 | $175,500 | $201,100 |
| 2017 | $7,902 | $356,600 | $161,600 | $195,000 |
| 2016 | $7,841 | $361,000 | $170,900 | $190,100 |
| 2015 | $7,495 | $344,600 | $159,800 | $184,800 |
| 2014 | $6,981 | $299,500 | $123,300 | $176,200 |
Source: Public Records
Map
Nearby Homes