19 Chestnut St Newburyport, MA 01950
Estimated Value: $1,360,000 - $1,481,330
3
Beds
3
Baths
2,500
Sq Ft
$565/Sq Ft
Est. Value
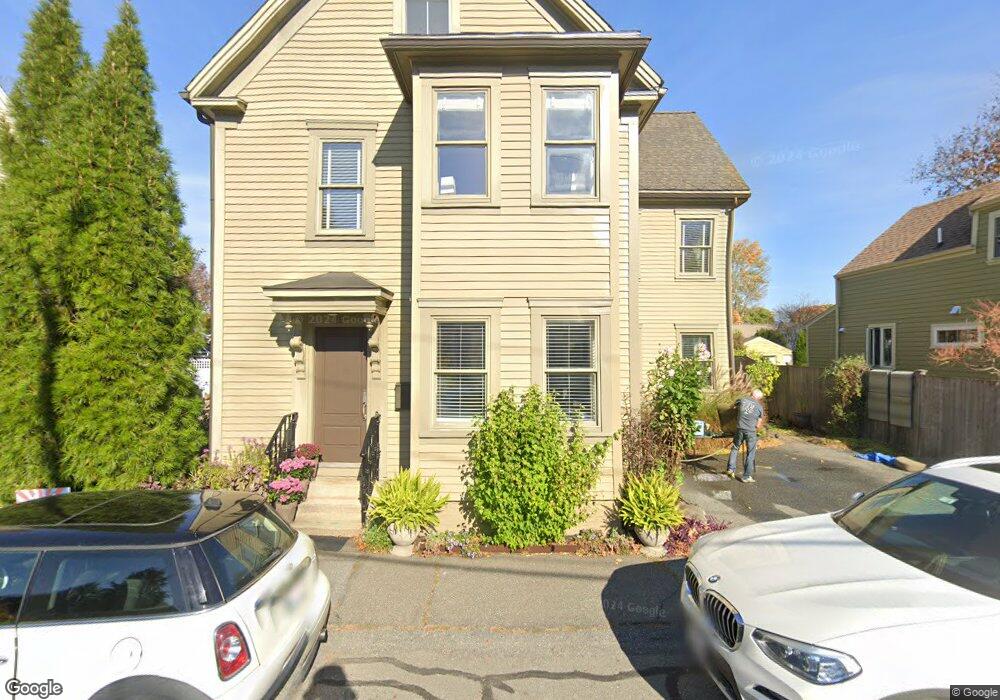
About This Home
This home is located at 19 Chestnut St, Newburyport, MA 01950 and is currently estimated at $1,411,777, approximately $564 per square foot. 19 Chestnut St is a home located in Essex County with nearby schools including Francis T. Bresnahan Elementary School, Edward G. Molin Elementary School, and Rupert A. Nock Middle School.
Ownership History
Date
Name
Owned For
Owner Type
Purchase Details
Closed on
Sep 3, 2004
Sold by
Bell Joseph C and Goldberg Paul H
Bought by
Bell Joseph C
Current Estimated Value
Purchase Details
Closed on
Jan 16, 2003
Sold by
Riera Vincent P and Evans Ellen J
Bought by
Bell Joseph C and Goldberg Paul H
Purchase Details
Closed on
Dec 29, 2000
Sold by
Tischner Stephen V and Hall Nancy L
Bought by
Reira Vincent P and Evans Ellen J
Purchase Details
Closed on
Sep 2, 1994
Sold by
Ingalls Jennifer J and Ingalls Joel T
Bought by
Hall Nancy L
Purchase Details
Closed on
Feb 12, 1993
Sold by
Foley Adam D
Bought by
James Jennifer and Ingalls Joel T
Create a Home Valuation Report for This Property
The Home Valuation Report is an in-depth analysis detailing your home's value as well as a comparison with similar homes in the area
Home Values in the Area
Average Home Value in this Area
Purchase History
| Date | Buyer | Sale Price | Title Company |
|---|---|---|---|
| Bell Joseph C | -- | -- | |
| Bell Joseph C | $553,000 | -- | |
| Reira Vincent P | $352,000 | -- | |
| Hall Nancy L | $134,000 | -- | |
| James Jennifer | $4,761 | -- | |
| James Jennifer | $71,428 | -- | |
| James Jennifer | $4,761 | -- | |
| James Jennifer | $4,761 | -- | |
| James Jennifer | $14,285 | -- |
Source: Public Records
Mortgage History
| Date | Status | Borrower | Loan Amount |
|---|---|---|---|
| Open | James Jennifer | $265,000 | |
| Closed | James Jennifer | $299,200 |
Source: Public Records
Tax History Compared to Growth
Tax History
| Year | Tax Paid | Tax Assessment Tax Assessment Total Assessment is a certain percentage of the fair market value that is determined by local assessors to be the total taxable value of land and additions on the property. | Land | Improvement |
|---|---|---|---|---|
| 2025 | $12,349 | $1,289,000 | $396,900 | $892,100 |
| 2024 | $11,722 | $1,175,700 | $360,800 | $814,900 |
| 2023 | $12,122 | $1,128,700 | $313,800 | $814,900 |
| 2022 | $11,479 | $955,800 | $261,400 | $694,400 |
| 2021 | $11,004 | $870,600 | $237,700 | $632,900 |
| 2020 | $10,818 | $842,500 | $237,700 | $604,800 |
| 2019 | $10,447 | $798,700 | $237,700 | $561,000 |
| 2018 | $10,109 | $762,400 | $226,400 | $536,000 |
| 2017 | $9,554 | $710,300 | $215,600 | $494,700 |
| 2016 | $9,577 | $715,200 | $196,400 | $518,800 |
| 2015 | $8,998 | $674,500 | $196,400 | $478,100 |
Source: Public Records
Map
Nearby Homes
- 17 Madison St
- 26 Beacon Ave
- 113 Prospect St Unit B
- 164 Water St Unit A
- 166 Water St Unit B
- 57 Lime St Unit 1
- 58 Lime St Unit 5
- 4 Goodwin Ave
- 33 Union St
- 1 Lancaster Rd
- 42 Federal St Unit B
- 11 Orange St Unit 2
- 95 High St Unit 4
- 95 High St Unit 1
- 11 Charter St
- 105 State St Unit 301
- 105 State St Unit 101
- 105 State St Unit 201
- 30-32 Water St Unit 4
- 10 10th St