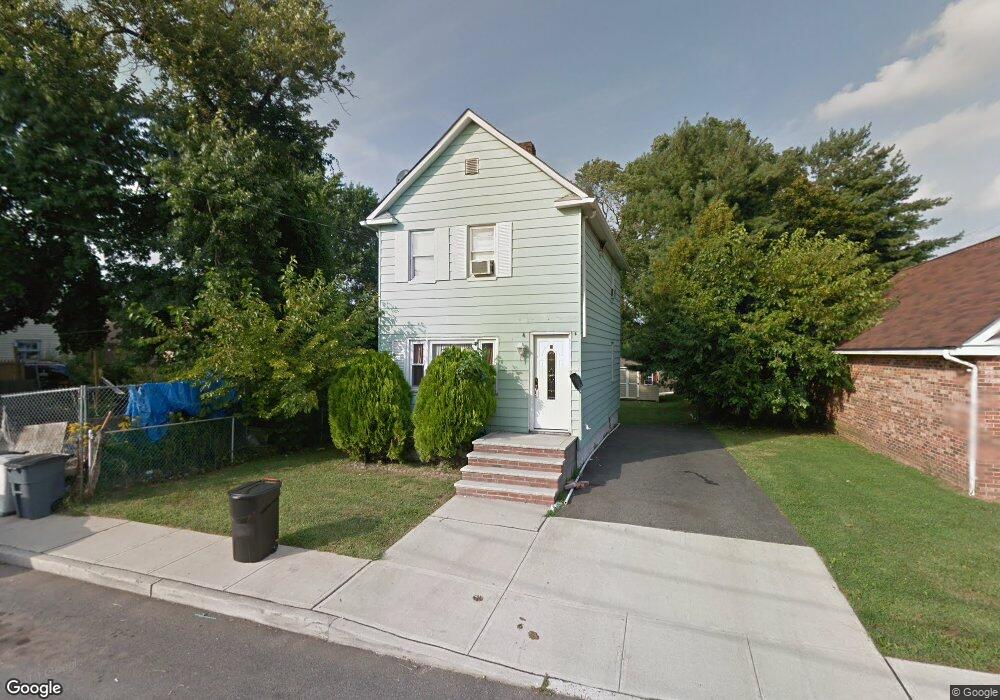
19 Clinton St Matawan, NJ 07747
Estimated Value: $371,000 - $481,000
3
Beds
1
Bath
1,120
Sq Ft
$381/Sq Ft
Est. Value
About This Home
This home is located at 19 Clinton St, Matawan, NJ 07747 and is currently estimated at $427,061, approximately $381 per square foot. 19 Clinton St is a home located in Monmouth County with nearby schools including Matawan Reg High School, St. Joseph Elementary School, and St Benedict School.
Ownership History
Date
Name
Owned For
Owner Type
Purchase Details
Closed on
Aug 15, 2006
Sold by
Pasius Venel
Bought by
Gelin Ercilia Pacius
Current Estimated Value
Purchase Details
Closed on
Jul 22, 2005
Sold by
Tenenzapf Jerry
Bought by
Gelin Ercilia Pacius and Pasius Venel
Home Financials for this Owner
Home Financials are based on the most recent Mortgage that was taken out on this home.
Original Mortgage
$192,971
Interest Rate
5.66%
Mortgage Type
FHA
Purchase Details
Closed on
Oct 31, 1994
Sold by
Lawson Pauline
Bought by
Gray Haywood
Create a Home Valuation Report for This Property
The Home Valuation Report is an in-depth analysis detailing your home's value as well as a comparison with similar homes in the area
Home Values in the Area
Average Home Value in this Area
Purchase History
| Date | Buyer | Sale Price | Title Company |
|---|---|---|---|
| Gelin Ercilia Pacius | -- | -- | |
| Gelin Ercilia Pacius | $196,000 | -- | |
| Gray Haywood | $60,000 | -- |
Source: Public Records
Mortgage History
| Date | Status | Borrower | Loan Amount |
|---|---|---|---|
| Previous Owner | Gelin Ercilia Pacius | $192,971 |
Source: Public Records
Tax History Compared to Growth
Tax History
| Year | Tax Paid | Tax Assessment Tax Assessment Total Assessment is a certain percentage of the fair market value that is determined by local assessors to be the total taxable value of land and additions on the property. | Land | Improvement |
|---|---|---|---|---|
| 2025 | $8,016 | $370,500 | $276,500 | $94,000 |
| 2024 | $7,670 | $367,200 | $291,500 | $75,700 |
| 2023 | $7,670 | $352,800 | $281,500 | $71,300 |
| 2022 | $6,314 | $271,400 | $203,500 | $67,900 |
| 2021 | $4,673 | $232,400 | $170,500 | $61,900 |
| 2020 | $6,063 | $221,600 | $160,500 | $61,100 |
| 2019 | $5,900 | $216,100 | $156,500 | $59,600 |
| 2018 | $5,839 | $210,400 | $151,500 | $58,900 |
| 2017 | $5,607 | $199,200 | $141,500 | $57,700 |
| 2016 | $5,333 | $193,500 | $136,500 | $57,000 |
| 2015 | $4,819 | $176,200 | $121,500 | $54,700 |
| 2014 | $4,717 | $173,100 | $116,500 | $56,600 |
Source: Public Records
Map
Nearby Homes
- 101 Broad St
- 32 Lake Blvd
- 10 7th St
- 5 7th St
- 9 Fountain Ave
- 258 Jackson St
- 284 Broad St
- 23 Carol Ln
- 20 Johnson Ave
- 555 S Atlantic Ave Unit 6
- 7 Lucia Ct Unit 7
- 320 Main St
- 7 Sunset Ave
- 12 S Atlantic Ave Unit 14
- 111 Courtland Ln
- 8 Sutphin Ave
- 14 New Brunswick Ave
- 3 Sutphin Ave
- 70 Northland Ln
- 326 Sloan Ct Unit 326