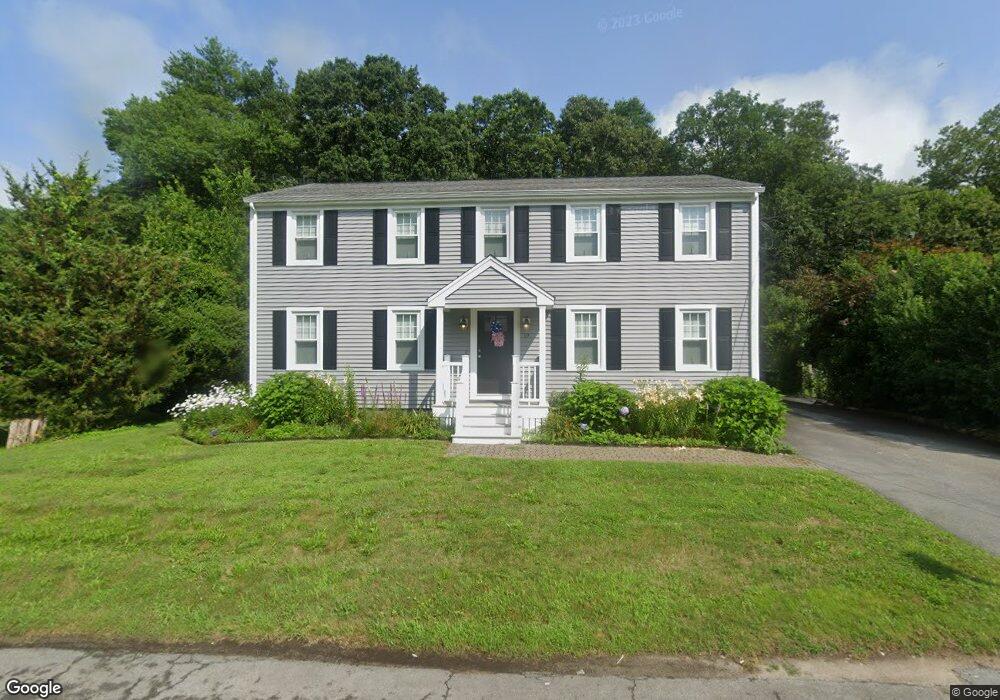
Estimated Value: $535,000 - $582,000
4
Beds
2
Baths
1,920
Sq Ft
$293/Sq Ft
Est. Value
About This Home
This home is located at 19 Clinton St, South Dartmouth, MA 02748 and is currently estimated at $562,287, approximately $292 per square foot. 19 Clinton St is a home located in Bristol County with nearby schools including Dartmouth High School and St. Teresa of Calcutta School.
Ownership History
Date
Name
Owned For
Owner Type
Purchase Details
Closed on
Oct 24, 2022
Sold by
Senra Rosemary and Senra Francisco
Bought by
Senra Francisco
Current Estimated Value
Home Financials for this Owner
Home Financials are based on the most recent Mortgage that was taken out on this home.
Original Mortgage
$408,000
Outstanding Balance
$391,711
Interest Rate
5.89%
Mortgage Type
New Conventional
Estimated Equity
$170,576
Purchase Details
Closed on
Jul 30, 2001
Sold by
Morris-Grime Joann
Bought by
Frizado Altino M and Frizardo Lisa M
Create a Home Valuation Report for This Property
The Home Valuation Report is an in-depth analysis detailing your home's value as well as a comparison with similar homes in the area
Home Values in the Area
Average Home Value in this Area
Purchase History
| Date | Buyer | Sale Price | Title Company |
|---|---|---|---|
| Senra Francisco | -- | None Available | |
| Senra Francisco | -- | None Available | |
| Frizado Altino M | $180,000 | -- | |
| Frizado Altino M | $180,000 | -- |
Source: Public Records
Mortgage History
| Date | Status | Borrower | Loan Amount |
|---|---|---|---|
| Open | Senra Francisco | $408,000 | |
| Closed | Senra Francisco | $408,000 | |
| Previous Owner | Frizado Altino M | $55,000 | |
| Previous Owner | Frizado Altino M | $259,000 |
Source: Public Records
Tax History Compared to Growth
Tax History
| Year | Tax Paid | Tax Assessment Tax Assessment Total Assessment is a certain percentage of the fair market value that is determined by local assessors to be the total taxable value of land and additions on the property. | Land | Improvement |
|---|---|---|---|---|
| 2025 | $3,455 | $401,300 | $154,400 | $246,900 |
| 2024 | $3,426 | $394,200 | $147,200 | $247,000 |
| 2023 | $3,366 | $367,100 | $136,600 | $230,500 |
| 2022 | $3,135 | $316,700 | $130,600 | $186,100 |
| 2021 | $4,088 | $295,600 | $115,300 | $180,300 |
| 2020 | $3,057 | $294,500 | $115,300 | $179,200 |
| 2019 | $107 | $288,300 | $115,300 | $173,000 |
| 2018 | $3,943 | $274,900 | $115,300 | $159,600 |
| 2017 | $2,655 | $265,000 | $108,700 | $156,300 |
| 2016 | $2,676 | $263,400 | $108,700 | $154,700 |
| 2015 | $2,618 | $258,200 | $101,600 | $156,600 |
| 2014 | $2,503 | $245,200 | $92,200 | $153,000 |
Source: Public Records
Map
Nearby Homes