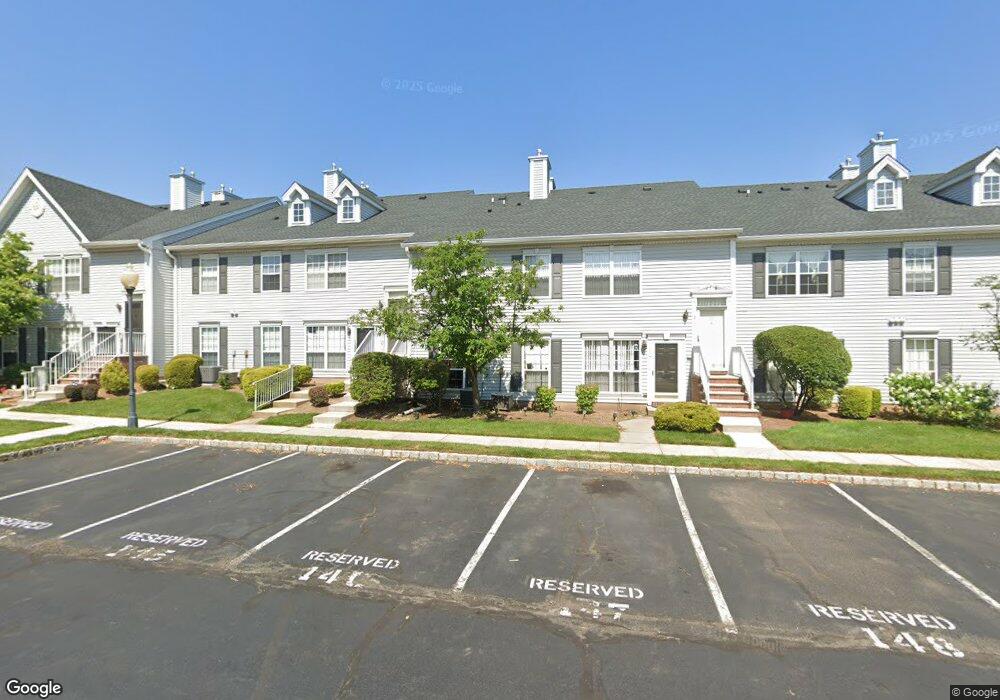
19 Columbus Dr Unit F1 Franklin Park, NJ 08823
Estimated Value: $183,485 - $248,000
--
Bed
--
Bath
972
Sq Ft
$218/Sq Ft
Est. Value
About This Home
This home is located at 19 Columbus Dr Unit F1, Franklin Park, NJ 08823 and is currently estimated at $211,828, approximately $217 per square foot. 19 Columbus Dr Unit F1 is a home located in Somerset County with nearby schools including Franklin High School, St. Augustine of Canterbury School, and Guidepost Montessori at Kendall Park.
Ownership History
Date
Name
Owned For
Owner Type
Purchase Details
Closed on
Mar 4, 2021
Sold by
Patel Niruben B
Bought by
Patel Bhaveshkumar G and Patel Shital
Current Estimated Value
Home Financials for this Owner
Home Financials are based on the most recent Mortgage that was taken out on this home.
Original Mortgage
$0
Interest Rate
2.7%
Purchase Details
Closed on
Jun 7, 2010
Sold by
Parikh Gopaldas and Parikh Divyaben
Bought by
Patel Niruben B
Home Financials for this Owner
Home Financials are based on the most recent Mortgage that was taken out on this home.
Original Mortgage
$75,000
Interest Rate
4.98%
Mortgage Type
New Conventional
Purchase Details
Closed on
Jun 12, 2001
Sold by
Patel Kint
Bought by
Parikh Divyaben and Parikh Gopaldas
Purchase Details
Closed on
Oct 23, 1992
Sold by
Hovnanian Somerset Viii K
Bought by
Patel Kirit D and Patel Manakshi K
Create a Home Valuation Report for This Property
The Home Valuation Report is an in-depth analysis detailing your home's value as well as a comparison with similar homes in the area
Home Values in the Area
Average Home Value in this Area
Purchase History
| Date | Buyer | Sale Price | Title Company |
|---|---|---|---|
| Patel Bhaveshkumar G | $116,000 | None Listed On Document | |
| Patel Bhaveshkumar G | $116,000 | None Listed On Document | |
| Patel Niruben B | $100,087 | Stewart Title Guaranty Co | |
| Parikh Divyaben | $70,900 | -- | |
| Parikh Divyaben | $70,900 | -- | |
| Patel Kirit D | $48,000 | -- |
Source: Public Records
Mortgage History
| Date | Status | Borrower | Loan Amount |
|---|---|---|---|
| Closed | Patel Bhaveshkumar G | $0 | |
| Open | Patel Bhaveshkumar G | $92,800 | |
| Closed | Patel Bhaveshkumar G | $92,800 | |
| Previous Owner | Patel Niruben B | $75,000 |
Source: Public Records
Tax History Compared to Growth
Tax History
| Year | Tax Paid | Tax Assessment Tax Assessment Total Assessment is a certain percentage of the fair market value that is determined by local assessors to be the total taxable value of land and additions on the property. | Land | Improvement |
|---|---|---|---|---|
| 2025 | $1,834 | $101,700 | $20,000 | $81,700 |
| 2024 | $1,834 | $101,700 | $20,000 | $81,700 |
| 2023 | $1,955 | $101,700 | $20,000 | $81,700 |
| 2022 | $2,062 | $101,700 | $20,000 | $81,700 |
| 2021 | $2,080 | $101,700 | $20,000 | $81,700 |
| 2020 | $2,297 | $101,700 | $20,000 | $81,700 |
| 2019 | $2,326 | $101,700 | $20,000 | $81,700 |
| 2018 | $2,349 | $101,700 | $20,000 | $81,700 |
| 2017 | $2,358 | $101,700 | $20,000 | $81,700 |
| 2016 | $3,275 | $140,000 | $20,000 | $120,000 |
| 2015 | $2,363 | $101,700 | $20,000 | $81,700 |
| 2014 | $2,327 | $101,700 | $20,000 | $81,700 |
Source: Public Records
Map
Nearby Homes
- 22 Balboa Ln Unit 3806
- 47 Cabot Way
- 19 Desoto Dr
- 253 Columbus Dr
- 139 Gregory Ln
- 93 Gregory Ln
- 93 Gregory La Ln
- 27 Topaz Dr
- 22 Arthur Glick Blvd Unit C2
- 21 Gregory Ln Unit F1
- 124 Edward Dr
- 8 Amethyst Way
- 3241 Route 27
- 13 Roberts St
- 103 Amethyst Way
- 4 Frieda Ln
- 5 Stanworth Rd
- 89 Lindsey Ct Unit 4021
- 167 Rachel Ct
- 181 Rachel Ct
- 21 Columbus Dr
- 23 Columbus Dr
- 17 Columbus Dr
- 27 Columbus Dr Unit 1
- 27 Columbus Dr Unit 110
- 27 Columbus Dr
- 31 Columbus Dr Unit E1
- 11 Columbus Dr
- 29 Columbus Dr
- 9 Columbus Dr
- 13 Columbus Dr
- 15 Columbus Dr
- 3 Columbus Dr
- 33 Columbus Dr
- 1 Columbus Dr
- 5 Columbus Dr
- 7 Columbus Dr
- 35 Columbus Dr
- 37 Columbus Dr
- 10 Columbus Dr