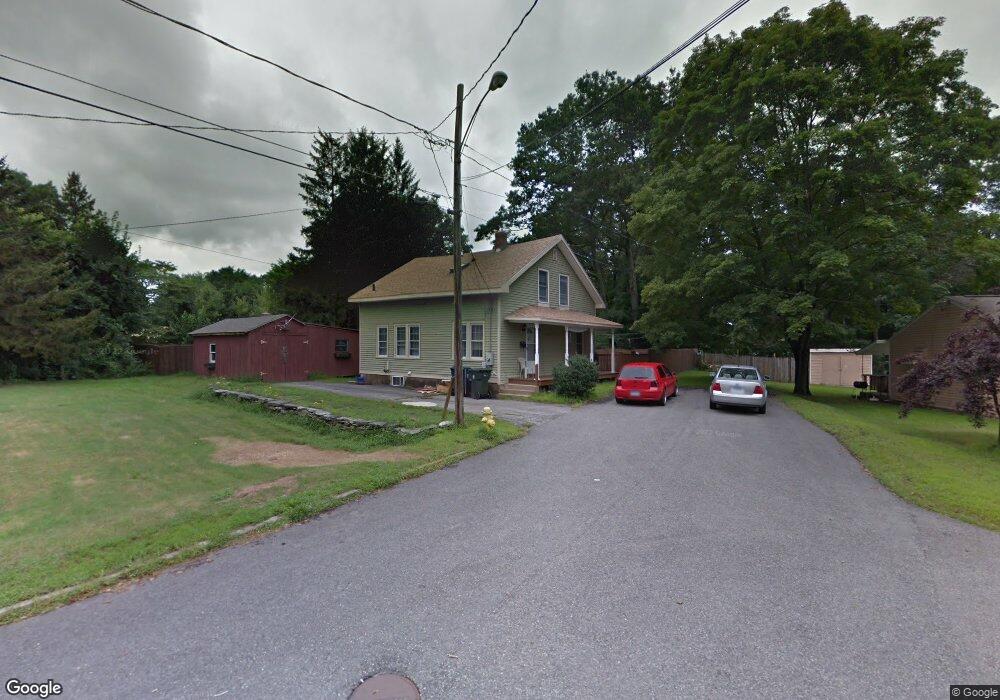
19 Connor St Willimantic, CT 06226
Estimated Value: $273,000 - $285,000
4
Beds
2
Baths
1,380
Sq Ft
$204/Sq Ft
Est. Value
About This Home
This home is located at 19 Connor St, Willimantic, CT 06226 and is currently estimated at $281,103, approximately $203 per square foot. 19 Connor St is a home located in Windham County with nearby schools including Windham Middle School, Windham High School, and St Mary St Joseph School.
Ownership History
Date
Name
Owned For
Owner Type
Purchase Details
Closed on
Apr 26, 2007
Sold by
Cobb Phillip and Gamache Hollie
Bought by
Nelson Justin J
Current Estimated Value
Purchase Details
Closed on
Sep 26, 2005
Sold by
Milhomme Duane P and Spector-Milhomme Carrie L
Bought by
Cobb Phillip and Gamache Hollie
Purchase Details
Closed on
Apr 28, 2000
Sold by
Allard Norman and Allard Joanie
Bought by
Milhomme Duane and Milhomme Carie
Purchase Details
Closed on
May 13, 1988
Sold by
Bonanno Gertrude
Bought by
Allard Norman
Create a Home Valuation Report for This Property
The Home Valuation Report is an in-depth analysis detailing your home's value as well as a comparison with similar homes in the area
Home Values in the Area
Average Home Value in this Area
Purchase History
| Date | Buyer | Sale Price | Title Company |
|---|---|---|---|
| Nelson Justin J | $169,000 | -- | |
| Cobb Phillip | $175,000 | -- | |
| Milhomme Duane | $107,000 | -- | |
| Allard Norman | $110,000 | -- |
Source: Public Records
Mortgage History
| Date | Status | Borrower | Loan Amount |
|---|---|---|---|
| Open | Allard Norman | $116,064 | |
| Closed | Allard Norman | $116,064 |
Source: Public Records
Tax History
| Year | Tax Paid | Tax Assessment Tax Assessment Total Assessment is a certain percentage of the fair market value that is determined by local assessors to be the total taxable value of land and additions on the property. | Land | Improvement |
|---|---|---|---|---|
| 2025 | $5,298 | $143,110 | $28,240 | $114,870 |
| 2024 | $5,304 | $143,110 | $28,240 | $114,870 |
| 2023 | $4,050 | $85,440 | $24,560 | $60,880 |
| 2022 | $3,990 | $85,440 | $24,560 | $60,880 |
| 2021 | $4,280 | $85,440 | $24,560 | $60,880 |
| 2020 | $4,270 | $85,440 | $24,560 | $60,880 |
| 2019 | $4,201 | $85,440 | $24,560 | $60,880 |
| 2017 | $3,486 | $73,210 | $19,370 | $53,840 |
| 2015 | $3,366 | $73,210 | $19,370 | $53,840 |
| 2014 | $3,180 | $73,210 | $19,370 | $53,840 |
Source: Public Records
Map
Nearby Homes
Your Personal Tour Guide
Ask me questions while you tour the home.