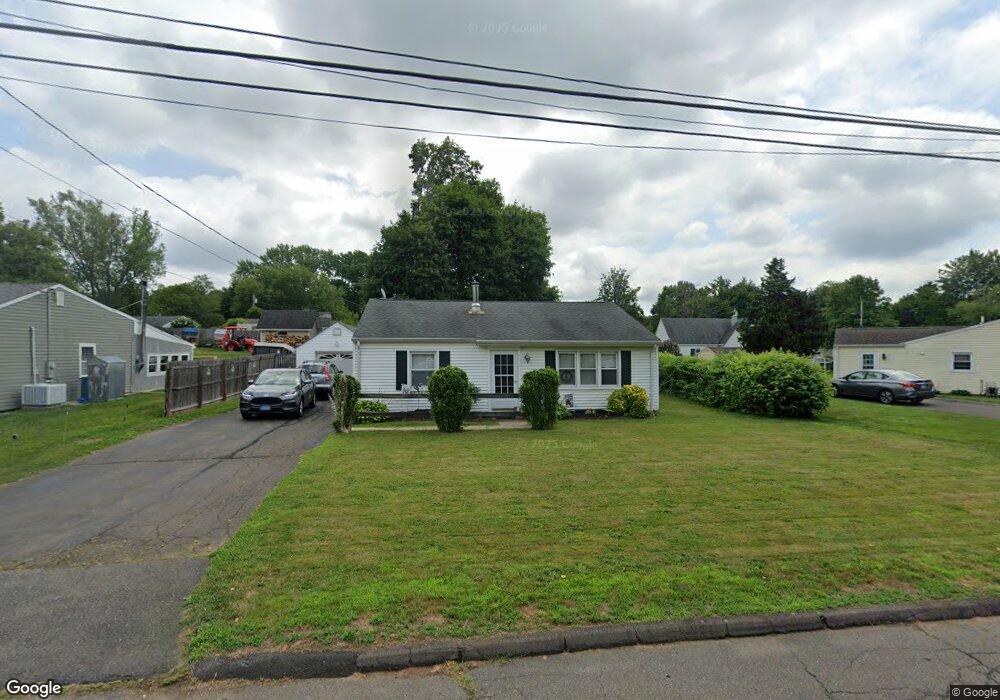
19 Cooper Ave Wallingford, CT 06492
Estimated Value: $314,786 - $332,000
2
Beds
1
Bath
1,132
Sq Ft
$289/Sq Ft
Est. Value
About This Home
This home is located at 19 Cooper Ave, Wallingford, CT 06492 and is currently estimated at $326,947, approximately $288 per square foot. 19 Cooper Ave is a home located in New Haven County with nearby schools including Moses Y Beach Elementary School, Rock Hill Elementary School, and Dag Hammarskjold Middle School.
Ownership History
Date
Name
Owned For
Owner Type
Purchase Details
Closed on
Feb 17, 2025
Sold by
Natale Linda and Lohre Amy
Bought by
Natale 2025 Irt and Lohre
Current Estimated Value
Purchase Details
Closed on
Sep 26, 1990
Sold by
Miller Chester R
Bought by
Natale Linda
Create a Home Valuation Report for This Property
The Home Valuation Report is an in-depth analysis detailing your home's value as well as a comparison with similar homes in the area
Home Values in the Area
Average Home Value in this Area
Purchase History
| Date | Buyer | Sale Price | Title Company |
|---|---|---|---|
| Natale 2025 Irt | -- | None Available | |
| Natale 2025 Irt | -- | None Available | |
| Natale Linda | $122,400 | -- |
Source: Public Records
Mortgage History
| Date | Status | Borrower | Loan Amount |
|---|---|---|---|
| Previous Owner | Natale Linda | $42,000 | |
| Previous Owner | Natale Linda | $53,456 | |
| Previous Owner | Natale Linda | $178,000 | |
| Previous Owner | Natale Linda | $99,200 |
Source: Public Records
Tax History
| Year | Tax Paid | Tax Assessment Tax Assessment Total Assessment is a certain percentage of the fair market value that is determined by local assessors to be the total taxable value of land and additions on the property. | Land | Improvement |
|---|---|---|---|---|
| 2025 | $4,674 | $193,800 | $93,100 | $100,700 |
| 2024 | $4,099 | $133,700 | $74,100 | $59,600 |
| 2023 | $3,923 | $133,700 | $74,100 | $59,600 |
| 2022 | $3,883 | $133,700 | $74,100 | $59,600 |
| 2021 | $3,813 | $133,700 | $74,100 | $59,600 |
| 2020 | $3,766 | $129,000 | $71,700 | $57,300 |
| 2019 | $3,766 | $129,000 | $71,700 | $57,300 |
| 2018 | $3,695 | $129,000 | $71,700 | $57,300 |
| 2017 | $3,683 | $129,000 | $71,700 | $57,300 |
| 2016 | $3,598 | $129,000 | $71,700 | $57,300 |
| 2015 | $3,436 | $125,100 | $71,700 | $53,400 |
| 2014 | $3,364 | $125,100 | $71,700 | $53,400 |
Source: Public Records
Map
Nearby Homes
- 134 E Main St
- 147 Constitution St
- 50 Carr St
- 924 E Center St
- 116 Putter Dr Unit 116
- 70 Putter Dr Unit 211
- 16 Putter Dr Unit 207S
- 21 Putter Dr Unit 303S
- 1 Dean Dr
- 19 Perkins Dr
- 229 Woodhouse Ave
- 39 Farm Hill Rd
- 17 Olde Village Cir Unit 17
- 357 Long Hill Rd
- 27 Londonderry Dr
- 570 N Main St
- 1095 Durham Rd
- 65 Tremper Dr
- 303 S Elm St Unit 303
- 85 N Colony St
Your Personal Tour Guide
Ask me questions while you tour the home.