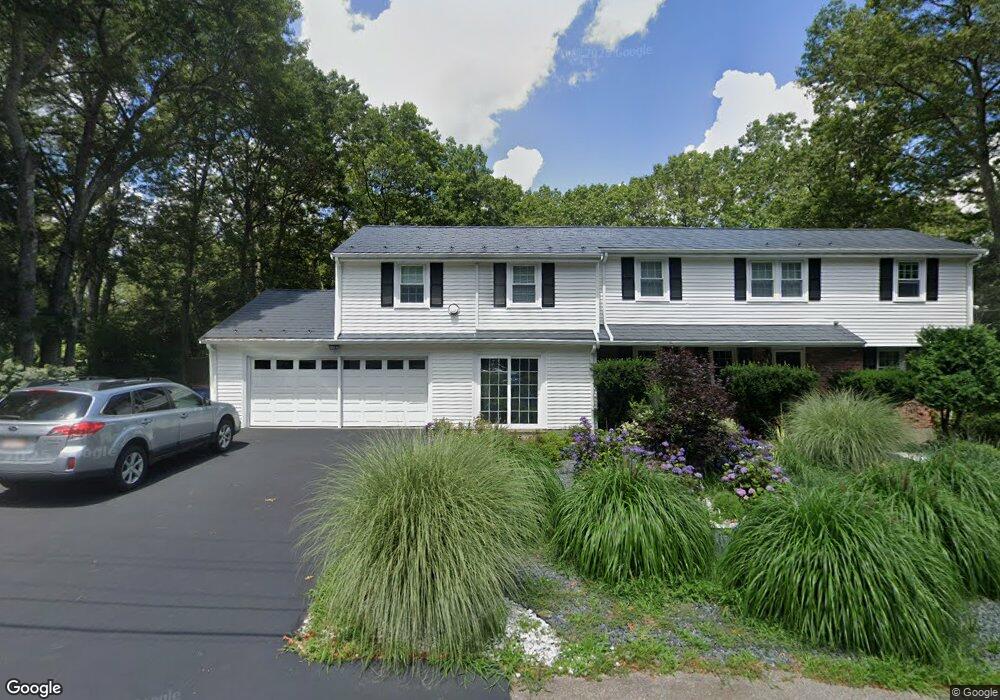
19 Country Ln Unit 1 Sharon, MA 02067
Estimated Value: $794,001 - $1,009,000
5
Beds
3
Baths
2,250
Sq Ft
$396/Sq Ft
Est. Value
About This Home
This home is located at 19 Country Ln Unit 1, Sharon, MA 02067 and is currently estimated at $890,500, approximately $395 per square foot. 19 Country Ln Unit 1 is a home located in Norfolk County with nearby schools including East Elementary School, Sharon Middle School, and Sharon High School.
Ownership History
Date
Name
Owned For
Owner Type
Purchase Details
Closed on
Mar 1, 2022
Sold by
Narsky Ilya
Bought by
Narsky Rt
Current Estimated Value
Purchase Details
Closed on
Feb 17, 2020
Sold by
Roy Vivek and Roy Arundhati
Bought by
Narsky Ilya
Home Financials for this Owner
Home Financials are based on the most recent Mortgage that was taken out on this home.
Original Mortgage
$459,900
Interest Rate
3.4%
Mortgage Type
New Conventional
Purchase Details
Closed on
Feb 23, 2018
Sold by
Zeitler Barbara
Bought by
Roy Vivek and Roy Arundhati
Home Financials for this Owner
Home Financials are based on the most recent Mortgage that was taken out on this home.
Original Mortgage
$378,750
Interest Rate
3.13%
Mortgage Type
New Conventional
Purchase Details
Closed on
Nov 7, 1990
Sold by
Galas Stanley
Bought by
Kendall Jeffrey P
Create a Home Valuation Report for This Property
The Home Valuation Report is an in-depth analysis detailing your home's value as well as a comparison with similar homes in the area
Home Values in the Area
Average Home Value in this Area
Purchase History
| Date | Buyer | Sale Price | Title Company |
|---|---|---|---|
| Narsky Rt | -- | None Available | |
| Narsky Ilya | $574,900 | None Available | |
| Roy Vivek | $505,000 | -- | |
| Kendall Jeffrey P | $180,000 | -- |
Source: Public Records
Mortgage History
| Date | Status | Borrower | Loan Amount |
|---|---|---|---|
| Previous Owner | Narsky Ilya | $459,900 | |
| Previous Owner | Roy Vivek | $378,750 | |
| Previous Owner | Kendall Jeffrey P | $20,500 | |
| Previous Owner | Kendall Jeffrey P | $170,000 |
Source: Public Records
Tax History Compared to Growth
Tax History
| Year | Tax Paid | Tax Assessment Tax Assessment Total Assessment is a certain percentage of the fair market value that is determined by local assessors to be the total taxable value of land and additions on the property. | Land | Improvement |
|---|---|---|---|---|
| 2025 | $12,253 | $701,000 | $422,600 | $278,400 |
| 2024 | $11,710 | $666,100 | $387,700 | $278,400 |
| 2023 | $11,457 | $616,300 | $362,500 | $253,800 |
| 2022 | $10,626 | $538,000 | $302,000 | $236,000 |
| 2021 | $10,503 | $514,100 | $284,800 | $229,300 |
| 2020 | $9,768 | $514,100 | $284,800 | $229,300 |
| 2019 | $9,658 | $497,600 | $252,000 | $245,600 |
| 2018 | $9,544 | $492,700 | $247,100 | $245,600 |
| 2017 | $9,353 | $476,700 | $231,100 | $245,600 |
| 2016 | $9,152 | $455,100 | $231,100 | $224,000 |
| 2015 | $9,218 | $454,100 | $211,900 | $242,200 |
| 2014 | $8,536 | $415,400 | $192,700 | $222,700 |
Source: Public Records
Map
Nearby Homes