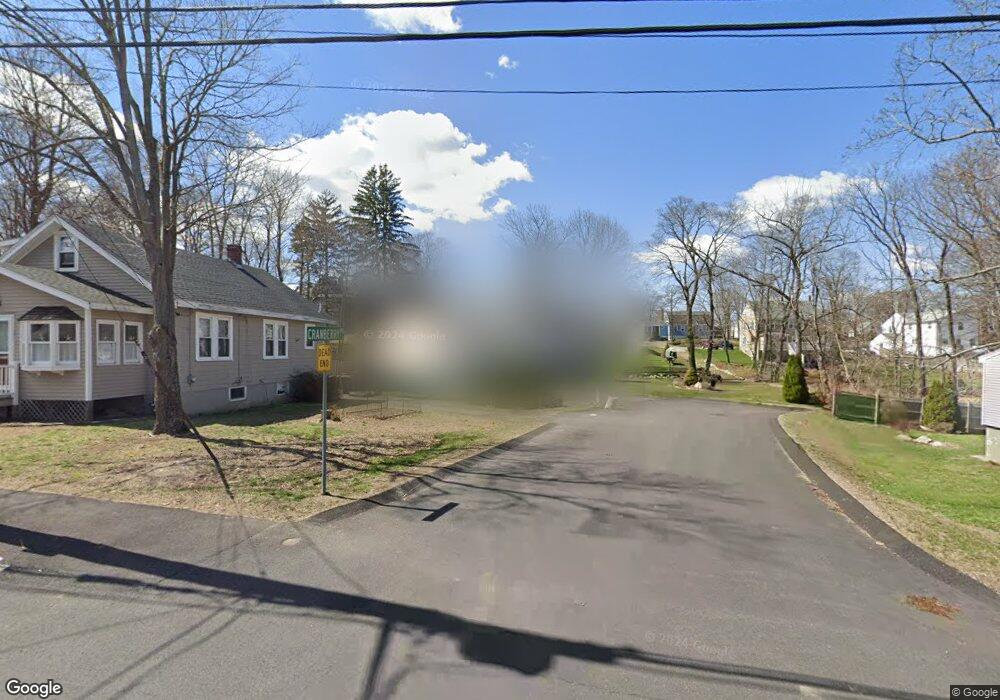
19 Cranberry Rd Weymouth, MA 02188
Weymouth Landing NeighborhoodEstimated Value: $742,000 - $837,000
3
Beds
3
Baths
1,960
Sq Ft
$406/Sq Ft
Est. Value
About This Home
This home is located at 19 Cranberry Rd, Weymouth, MA 02188 and is currently estimated at $796,681, approximately $406 per square foot. 19 Cranberry Rd is a home located in Norfolk County with nearby schools including Abigail Adams Middle School, Frederick C Murphy, and Weymouth Middle School Chapman.
Ownership History
Date
Name
Owned For
Owner Type
Purchase Details
Closed on
Aug 28, 2000
Sold by
Stephen Gosselin Inc
Bought by
Neenan Leo F and Neenan Theresa
Current Estimated Value
Home Financials for this Owner
Home Financials are based on the most recent Mortgage that was taken out on this home.
Original Mortgage
$192,000
Outstanding Balance
$69,779
Interest Rate
8.06%
Mortgage Type
Purchase Money Mortgage
Estimated Equity
$726,902
Purchase Details
Closed on
Mar 29, 2000
Sold by
Pellagrini Edward C
Bought by
Stephen Gosselin Inc
Create a Home Valuation Report for This Property
The Home Valuation Report is an in-depth analysis detailing your home's value as well as a comparison with similar homes in the area
Home Values in the Area
Average Home Value in this Area
Purchase History
| Date | Buyer | Sale Price | Title Company |
|---|---|---|---|
| Neenan Leo F | $302,000 | -- | |
| Stephen Gosselin Inc | $53,500 | -- |
Source: Public Records
Mortgage History
| Date | Status | Borrower | Loan Amount |
|---|---|---|---|
| Open | Stephen Gosselin Inc | $192,000 |
Source: Public Records
Tax History
| Year | Tax Paid | Tax Assessment Tax Assessment Total Assessment is a certain percentage of the fair market value that is determined by local assessors to be the total taxable value of land and additions on the property. | Land | Improvement |
|---|---|---|---|---|
| 2025 | $8,082 | $800,200 | $243,100 | $557,100 |
| 2024 | $7,901 | $769,300 | $231,600 | $537,700 |
| 2023 | $7,486 | $716,400 | $214,400 | $502,000 |
| 2022 | $7,308 | $637,700 | $198,600 | $439,100 |
| 2021 | $6,748 | $574,800 | $198,600 | $376,200 |
| 2020 | $6,469 | $542,700 | $198,600 | $344,100 |
| 2019 | $6,357 | $524,500 | $190,900 | $333,600 |
| 2018 | $6,188 | $495,000 | $181,800 | $313,200 |
| 2017 | $5,937 | $463,500 | $173,200 | $290,300 |
| 2016 | $5,750 | $449,200 | $166,500 | $282,700 |
| 2015 | $5,414 | $419,700 | $159,000 | $260,700 |
| 2014 | $5,223 | $392,700 | $147,900 | $244,800 |
Source: Public Records
Map
Nearby Homes
- 46 Roosevelt Rd
- 25 Richmond St
- 114 Broad St Unit D
- 11 Richmond St
- 19 Vine St Unit 3
- 19 Vine St Unit 2
- 122 Washington St Unit Twenty-two
- 16 Lindbergh Ave
- 16 Beechwood Rd
- 15 Summer St
- 70 Biscayne Ave
- 37 Lantern Ln
- 33 Congress St
- 41 Lantern Ln
- 125 Allen St Unit A
- 49 Cornish St
- 107 Summer St
- 51 Faxon St
- 97 Liberty St
- 29-31 Broad Street Place
Your Personal Tour Guide
Ask me questions while you tour the home.