Estimated Value: $156,645 - $201,000
2
Beds
1
Bath
913
Sq Ft
$201/Sq Ft
Est. Value
About This Home
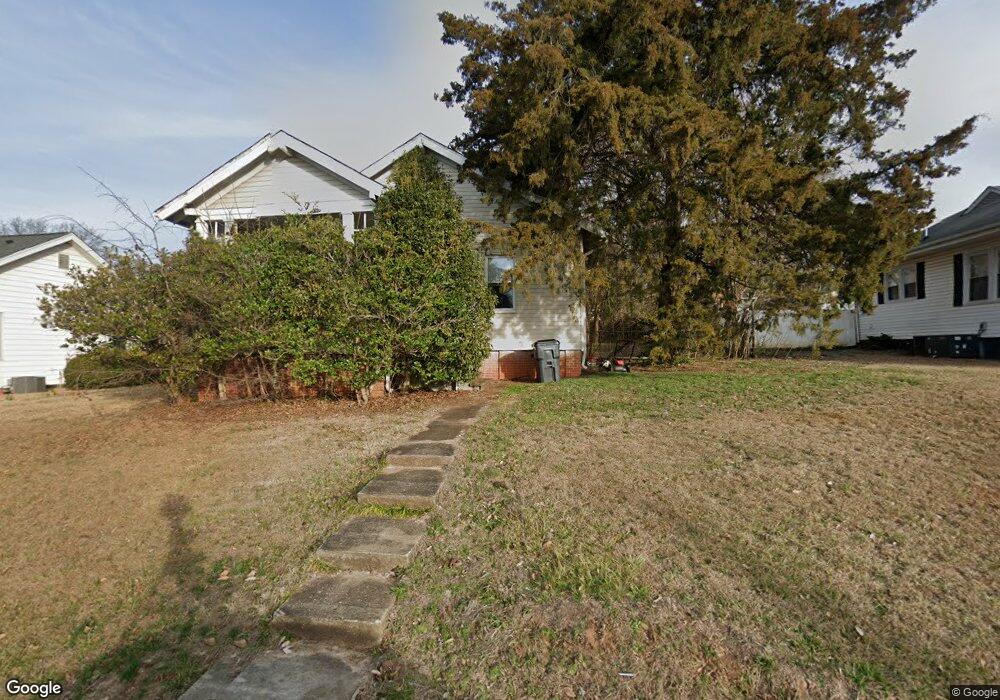
This home is located at 19 Crest St, Lyman, SC 29365 and is currently estimated at $183,661, approximately $201 per square foot. 19 Crest St is a home located in Spartanburg County with nearby schools including Byrnes Freshman Academy, Beech Springs Intermediate School, and James F. Byrnes High School.
Ownership History
Date
Name
Owned For
Owner Type
Purchase Details
Closed on
Aug 24, 2010
Sold by
Blt General Contracting Inc
Bought by
Leonard George Thomas
Current Estimated Value
Home Financials for this Owner
Home Financials are based on the most recent Mortgage that was taken out on this home.
Original Mortgage
$7,500
Outstanding Balance
$4,993
Interest Rate
4.6%
Mortgage Type
Future Advance Clause Open End Mortgage
Estimated Equity
$178,668
Purchase Details
Closed on
Apr 1, 2010
Sold by
Home Ownership Model Enterprises Llc
Bought by
Blt General Contracting Inc
Purchase Details
Closed on
Mar 30, 2010
Sold by
Derriso Anthony C and Derriso Evelyn Allen
Bought by
Home Ownership Model Enterprises Llc
Purchase Details
Closed on
Jul 6, 2001
Sold by
Frady Stephen E
Bought by
Derriso Anthony C and Derriso Evelyn Allen
Create a Home Valuation Report for This Property
The Home Valuation Report is an in-depth analysis detailing your home's value as well as a comparison with similar homes in the area
Home Values in the Area
Average Home Value in this Area
Purchase History
| Date | Buyer | Sale Price | Title Company |
|---|---|---|---|
| Leonard George Thomas | $77,500 | -- | |
| Blt General Contracting Inc | $50,000 | -- | |
| Home Ownership Model Enterprises Llc | $83,000 | -- | |
| Derriso Anthony C | $46,000 | -- |
Source: Public Records
Mortgage History
| Date | Status | Borrower | Loan Amount |
|---|---|---|---|
| Open | Leonard George Thomas | $7,500 | |
| Open | Leonard George Thomas | $68,500 |
Source: Public Records
Tax History
| Year | Tax Paid | Tax Assessment Tax Assessment Total Assessment is a certain percentage of the fair market value that is determined by local assessors to be the total taxable value of land and additions on the property. | Land | Improvement |
|---|---|---|---|---|
| 2022 | $804 | $3,556 | $632 | $2,924 |
| 2021 | $804 | $3,556 | $632 | $2,924 |
| 2020 | $789 | $3,556 | $632 | $2,924 |
| 2019 | $788 | $3,556 | $632 | $2,924 |
| 2018 | $763 | $3,556 | $632 | $2,924 |
| 2017 | $670 | $3,092 | $600 | $2,492 |
| 2016 | $655 | $3,092 | $600 | $2,492 |
| 2015 | $643 | $3,092 | $600 | $2,492 |
| 2014 | $643 | $3,092 | $600 | $2,492 |
Source: Public Records
Map
Nearby Homes
Your Personal Tour Guide
Ask me questions while you tour the home.