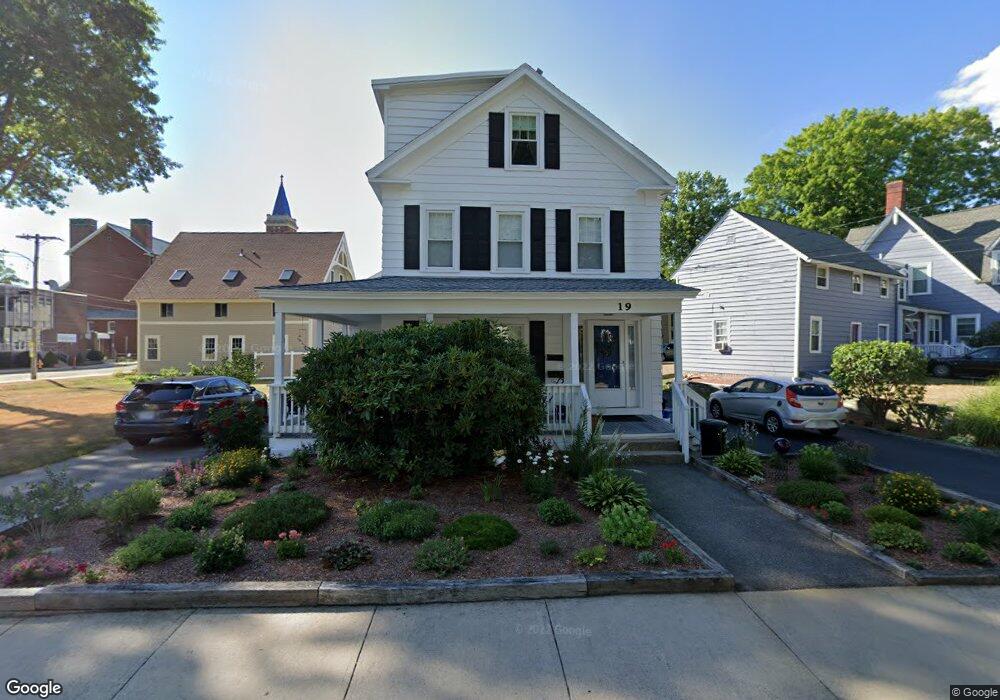
19 Cross St Westborough, MA 01581
Estimated Value: $634,163 - $766,000
2
Beds
1
Bath
605
Sq Ft
$1,170/Sq Ft
Est. Value
About This Home
This home is located at 19 Cross St, Westborough, MA 01581 and is currently estimated at $707,791, approximately $1,169 per square foot. 19 Cross St is a home located in Worcester County with nearby schools including Westborough High School, Ebridge Montessori School, and Westboro Knowledge Beginnings.
Ownership History
Date
Name
Owned For
Owner Type
Purchase Details
Closed on
Jun 29, 1973
Bought by
Fallon Paul M and Fallon Nancy M
Current Estimated Value
Create a Home Valuation Report for This Property
The Home Valuation Report is an in-depth analysis detailing your home's value as well as a comparison with similar homes in the area
Home Values in the Area
Average Home Value in this Area
Purchase History
| Date | Buyer | Sale Price | Title Company |
|---|---|---|---|
| Fallon Paul M | -- | -- |
Source: Public Records
Mortgage History
| Date | Status | Borrower | Loan Amount |
|---|---|---|---|
| Open | Fallon Paul M | $45,000 | |
| Closed | Fallon Paul M | $25,000 | |
| Closed | Fallon Paul M | $55,000 |
Source: Public Records
Tax History Compared to Growth
Tax History
| Year | Tax Paid | Tax Assessment Tax Assessment Total Assessment is a certain percentage of the fair market value that is determined by local assessors to be the total taxable value of land and additions on the property. | Land | Improvement |
|---|---|---|---|---|
| 2025 | $8,441 | $518,200 | $303,400 | $214,800 |
| 2024 | $7,941 | $483,900 | $282,100 | $201,800 |
| 2023 | $7,536 | $447,500 | $263,900 | $183,600 |
| 2022 | $6,956 | $376,200 | $211,900 | $164,300 |
| 2021 | $6,930 | $373,800 | $209,500 | $164,300 |
| 2020 | $6,548 | $357,400 | $197,900 | $159,500 |
| 2019 | $6,474 | $353,200 | $190,100 | $163,100 |
| 2018 | $5,643 | $305,700 | $174,600 | $131,100 |
| 2017 | $5,441 | $305,700 | $174,600 | $131,100 |
| 2016 | $5,343 | $300,700 | $174,600 | $126,100 |
| 2015 | $5,540 | $298,000 | $174,600 | $123,400 |
Source: Public Records
Map
Nearby Homes
- 14 Grove St Unit 2
- 21 South St Unit 31
- 75 South St
- 56 Ruggles St
- 15 Beach St
- 43 Church St
- 6 Folly Ln
- 7 Jennings Rd
- 4403 Peters Farm Way Unit 403
- 48 High Street Extension
- 23 Water St
- 19 Fisher St
- 7 Mayberry Dr Unit H
- 14 Mayberry Dr Unit 10
- 4 Upton Rd
- 22 Treetop Park
- 9 Treetop Park
- 19 Treetop Park Unit 19
- 39 Warren St
- 52 Treetop Park Unit 52