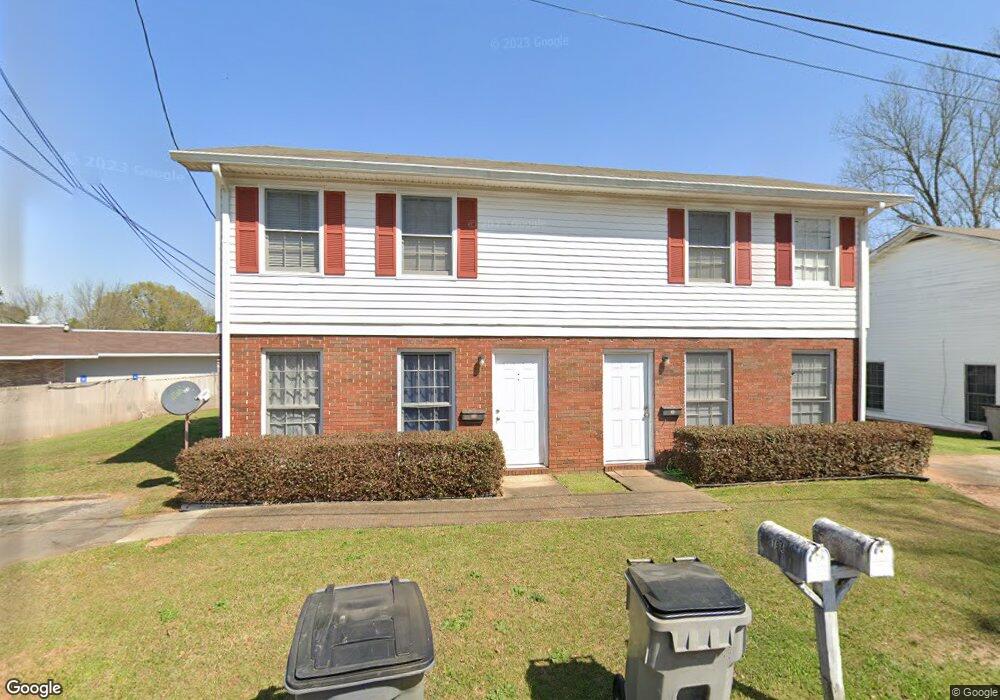
19 Curran Ave Lagrange, GA 30241
Estimated Value: $152,395 - $175,000
4
Beds
3
Baths
1,920
Sq Ft
$86/Sq Ft
Est. Value
About This Home
This home is located at 19 Curran Ave, Lagrange, GA 30241 and is currently estimated at $165,849, approximately $86 per square foot. 19 Curran Ave is a home located in Troup County with nearby schools including Franklin Forest Elementary School, Hollis Hand Elementary School, and Ethel W. Kight Elementary School.
Ownership History
Date
Name
Owned For
Owner Type
Purchase Details
Closed on
Jun 16, 2023
Sold by
Newman Charles
Bought by
Ct & Kk Properties Llc
Current Estimated Value
Purchase Details
Closed on
Dec 14, 2016
Sold by
Snellings Nancy L and Snellings Samuel N
Bought by
Newman Charles and Newman Kathryn
Purchase Details
Closed on
May 19, 2004
Sold by
Nancy Samuel and Nancy Snellings
Bought by
Snellings Properties Llc
Purchase Details
Closed on
Mar 17, 2004
Sold by
Corrective Copy
Bought by
Nancy Samuel and Nancy Snellings
Purchase Details
Closed on
Feb 12, 2004
Sold by
Robert T Upchurch
Bought by
Corrective Copy
Purchase Details
Closed on
Mar 7, 2003
Sold by
Upchurch Joel
Bought by
Robert T Upchurch
Purchase Details
Closed on
Jul 15, 1997
Sold by
Massengale Jas
Bought by
Upchurch Joel
Purchase Details
Closed on
Aug 1, 1985
Sold by
James W Mathis
Bought by
Massengale Jas
Purchase Details
Closed on
Oct 1, 1980
Sold by
Gerald T Ussery
Bought by
James W Mathis
Purchase Details
Closed on
Aug 23, 1976
Sold by
Walter E Welborn
Bought by
Gerald T Ussery
Purchase Details
Closed on
Jan 1, 1973
Sold by
Pepperell Mills
Bought by
Walter E Welborn
Create a Home Valuation Report for This Property
The Home Valuation Report is an in-depth analysis detailing your home's value as well as a comparison with similar homes in the area
Purchase History
| Date | Buyer | Sale Price | Title Company |
|---|---|---|---|
| Ct & Kk Properties Llc | -- | -- | |
| Newman Charles | $136,000 | -- | |
| Snellings Properties Llc | -- | -- | |
| Nancy Samuel | -- | -- | |
| Corrective Copy | $150,000 | -- | |
| Robert T Upchurch | -- | -- | |
| Upchurch Joel | $97,000 | -- | |
| Massengale Jas | $44,800 | -- | |
| James W Mathis | $28,500 | -- | |
| Gerald T Ussery | $2,200 | -- | |
| Walter E Welborn | -- | -- |
Source: Public Records
Tax History
| Year | Tax Paid | Tax Assessment Tax Assessment Total Assessment is a certain percentage of the fair market value that is determined by local assessors to be the total taxable value of land and additions on the property. | Land | Improvement |
|---|---|---|---|---|
| 2025 | $1,532 | $56,160 | $2,760 | $53,400 |
| 2024 | $1,361 | $49,920 | $2,760 | $47,160 |
| 2023 | $1,200 | $44,000 | $2,760 | $41,240 |
| 2022 | $1,142 | $40,920 | $2,760 | $38,160 |
| 2021 | $930 | $30,840 | $2,760 | $28,080 |
| 2020 | $930 | $30,840 | $2,760 | $28,080 |
| 2019 | $837 | $27,760 | $2,760 | $25,000 |
| 2018 | $834 | $27,656 | $3,016 | $24,640 |
| 2017 | $820 | $27,656 | $3,016 | $24,640 |
| 2016 | $808 | $26,796 | $3,016 | $23,780 |
| 2015 | $810 | $26,796 | $3,016 | $23,780 |
| 2014 | $773 | $25,544 | $3,016 | $22,528 |
| 2013 | -- | $27,504 | $3,016 | $24,488 |
Source: Public Records
Map
Nearby Homes
- 5 Curran Ave
- 204 Cleveland Dr
- 212 Cleveland Dr
- 87 Youngs Mill Rd
- 4 1/2 Barnard Ave
- 115 Clara Jean Ct
- 224 Rutland Cir
- 110 Lenox Cir
- 0 N Barnard Ave
- 107 N Barnard Ave
- 15 Fulton St
- 203 Bonaventure Dr
- 210 Hearthstone Dr
- 2 Louise St
- 616 S Harlem Cir
- 3 Gulfstream Dr
- 5 Gulfstream Dr
- 121 de Groat St
- 101 Sarah Ln
- 412 Sweetwood Ct Unit A36
Your Personal Tour Guide
Ask me questions while you tour the home.