Estimated Value: $382,699 - $446,000
2
Beds
1
Bath
816
Sq Ft
$501/Sq Ft
Est. Value
About This Home
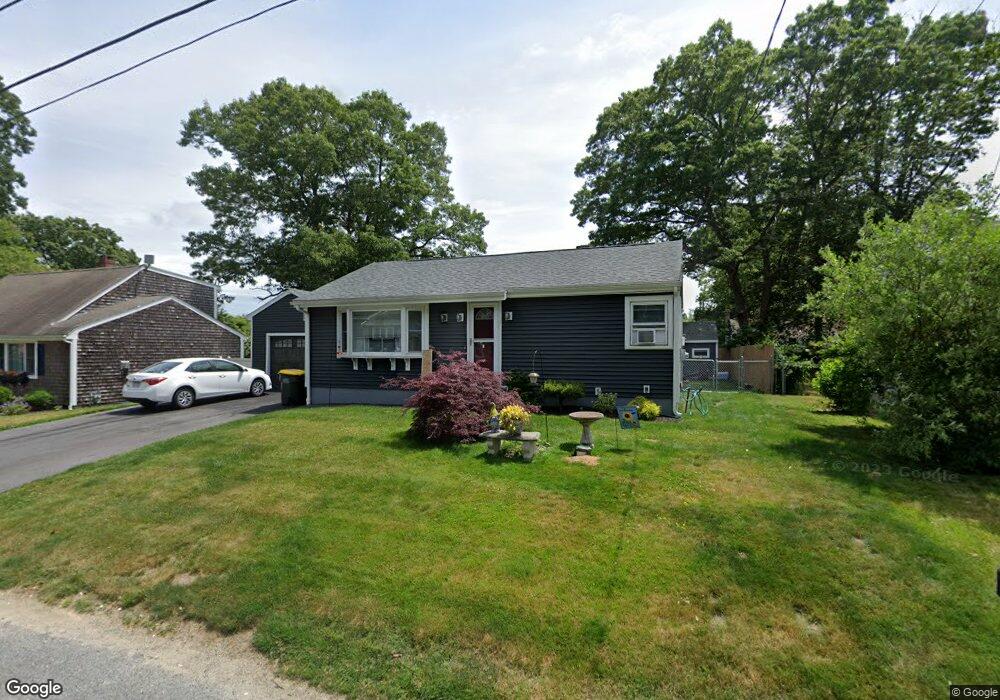
This home is located at 19 D Dr, Westport, MA 02790 and is currently estimated at $408,425, approximately $500 per square foot. 19 D Dr is a home located in Bristol County with nearby schools including Alice A. Macomber Primary School, Westport Elementary School, and Westport Middle-High School.
Ownership History
Date
Name
Owned For
Owner Type
Purchase Details
Closed on
May 8, 2009
Sold by
Robichaud George L and Robichaud Colleen
Bought by
Rodrigues Donna A
Current Estimated Value
Home Financials for this Owner
Home Financials are based on the most recent Mortgage that was taken out on this home.
Original Mortgage
$185,576
Interest Rate
4.9%
Mortgage Type
Purchase Money Mortgage
Create a Home Valuation Report for This Property
The Home Valuation Report is an in-depth analysis detailing your home's value as well as a comparison with similar homes in the area
Home Values in the Area
Average Home Value in this Area
Purchase History
| Date | Buyer | Sale Price | Title Company |
|---|---|---|---|
| Rodrigues Donna A | $189,000 | -- |
Source: Public Records
Mortgage History
| Date | Status | Borrower | Loan Amount |
|---|---|---|---|
| Open | Rodrigues Donna A | $185,540 | |
| Closed | Rodrigues Donna A | $185,576 |
Source: Public Records
Tax History Compared to Growth
Tax History
| Year | Tax Paid | Tax Assessment Tax Assessment Total Assessment is a certain percentage of the fair market value that is determined by local assessors to be the total taxable value of land and additions on the property. | Land | Improvement |
|---|---|---|---|---|
| 2025 | $2,204 | $295,800 | $156,300 | $139,500 |
| 2024 | $2,184 | $282,500 | $144,800 | $137,700 |
| 2023 | $2,082 | $255,100 | $131,900 | $123,200 |
| 2022 | $1,829 | $224,800 | $119,900 | $104,900 |
| 2021 | $1,829 | $212,200 | $109,000 | $103,200 |
| 2020 | $1,753 | $207,900 | $104,700 | $103,200 |
| 2019 | $1,718 | $207,700 | $104,700 | $103,000 |
| 2018 | $1,474 | $180,400 | $104,400 | $76,000 |
| 2017 | $1,400 | $175,700 | $101,100 | $74,600 |
| 2016 | $1,333 | $168,500 | $97,700 | $70,800 |
| 2015 | $1,295 | $163,300 | $99,900 | $63,400 |
Source: Public Records
Map
Nearby Homes