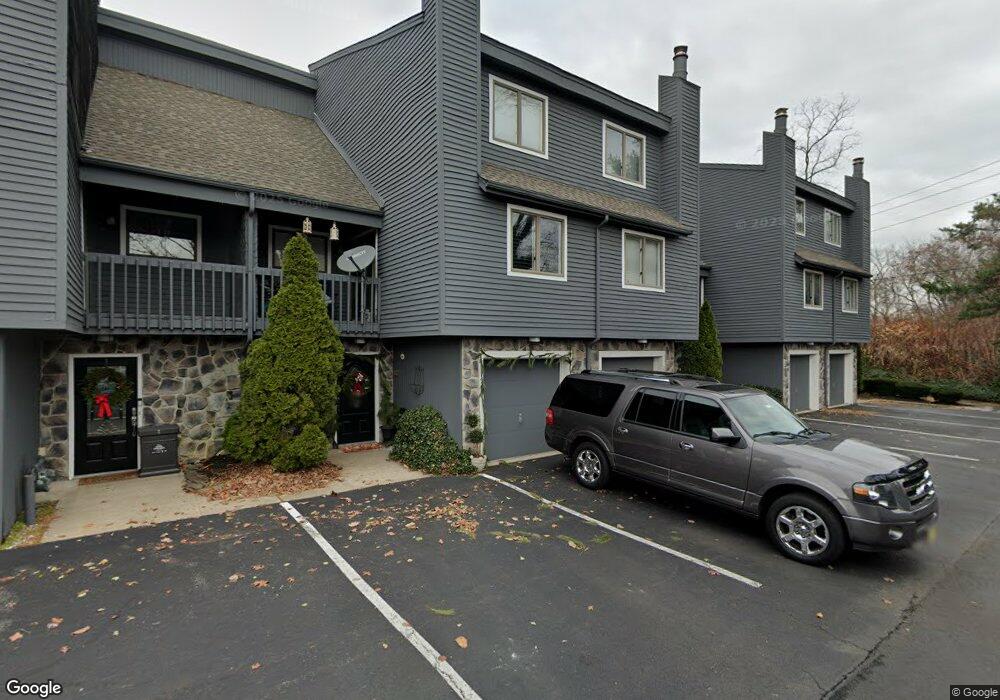
19 Devon Ct Spring Lake, NJ 07762
Estimated Value: $587,000 - $1,483,000
2
Beds
2
Baths
1,784
Sq Ft
$494/Sq Ft
Est. Value
About This Home
This home is located at 19 Devon Ct, Spring Lake, NJ 07762 and is currently estimated at $881,078, approximately $493 per square foot. 19 Devon Ct is a home located in Monmouth County with nearby schools including Spring Lake Heights Elementary School, St. Rose Grammar School, and St Rose High School.
Ownership History
Date
Name
Owned For
Owner Type
Purchase Details
Closed on
Oct 29, 1997
Sold by
Croak Paul
Bought by
Confrey Matthew and Mangini Priscilla
Current Estimated Value
Home Financials for this Owner
Home Financials are based on the most recent Mortgage that was taken out on this home.
Original Mortgage
$134,000
Outstanding Balance
$21,817
Interest Rate
7.19%
Mortgage Type
FHA
Estimated Equity
$859,261
Create a Home Valuation Report for This Property
The Home Valuation Report is an in-depth analysis detailing your home's value as well as a comparison with similar homes in the area
Home Values in the Area
Average Home Value in this Area
Purchase History
| Date | Buyer | Sale Price | Title Company |
|---|---|---|---|
| Confrey Matthew | $138,000 | -- |
Source: Public Records
Mortgage History
| Date | Status | Borrower | Loan Amount |
|---|---|---|---|
| Open | Confrey Matthew | $134,000 |
Source: Public Records
Tax History Compared to Growth
Tax History
| Year | Tax Paid | Tax Assessment Tax Assessment Total Assessment is a certain percentage of the fair market value that is determined by local assessors to be the total taxable value of land and additions on the property. | Land | Improvement |
|---|---|---|---|---|
| 2025 | $6,453 | $639,900 | $425,000 | $214,900 |
| 2024 | $6,040 | $612,800 | $401,800 | $211,000 |
| 2023 | $6,040 | $539,300 | $350,000 | $189,300 |
| 2022 | $5,203 | $431,400 | $178,000 | $253,400 |
| 2021 | $5,203 | $385,400 | $155,000 | $230,400 |
| 2020 | $4,944 | $364,100 | $155,000 | $209,100 |
| 2019 | $4,915 | $358,200 | $155,000 | $203,200 |
| 2018 | $4,833 | $342,800 | $155,000 | $187,800 |
| 2017 | $4,631 | $340,500 | $155,000 | $185,500 |
| 2016 | $5,620 | $408,100 | $225,000 | $183,100 |
| 2015 | $5,539 | $403,400 | $225,000 | $178,400 |
| 2014 | $5,200 | $387,200 | $210,000 | $177,200 |
Source: Public Records
Map
Nearby Homes
- 1027 2nd Ave
- 15 Wyckham Rd
- 12 Wyckham Rd
- 737 20th Ave
- 1813 Margerum Ave
- 1905 3rd Ave
- 905 Wall Rd
- 708 18th Ave
- 1012 Glenn St
- 1014 Glenn St
- 1825 Pine Terrace
- 1211 18th Ave
- 1024 17th Ave
- 2419 Kipling Ave
- 1800-1802 Pine Terrace
- 1807-1809 Laurel Terrace
- 1704 Grove St
- 620 Redmond Ave
- 923 Woodland Ave
- 1630 Oakwood Rd