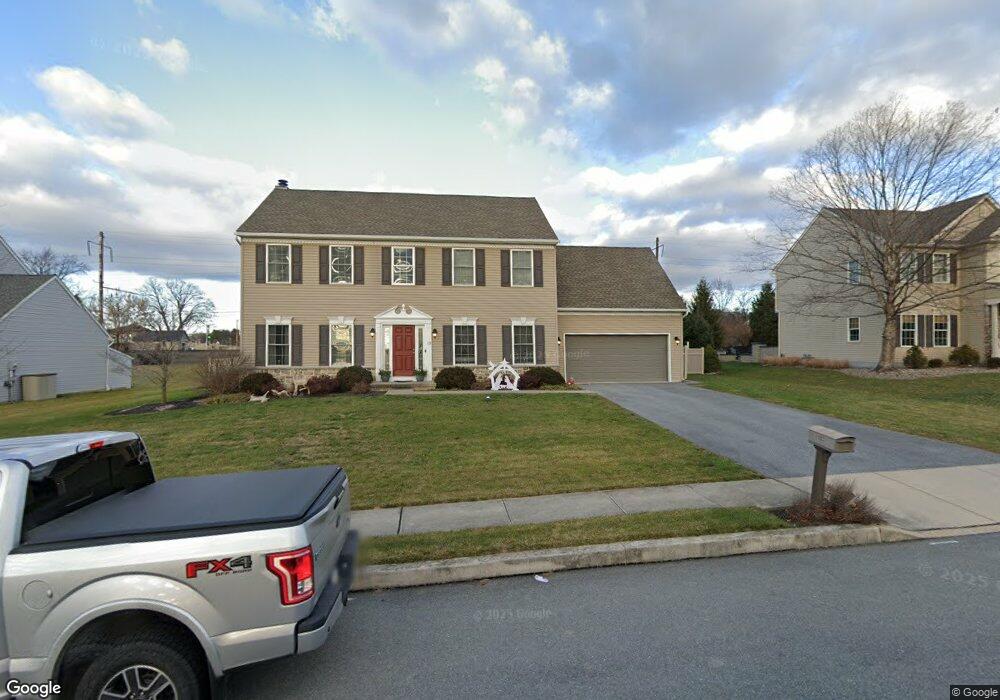
19 Dietz Ln Mount Joy, PA 17552
Estimated Value: $529,000 - $617,000
4
Beds
3
Baths
2,480
Sq Ft
$226/Sq Ft
Est. Value
About This Home
This home is located at 19 Dietz Ln, Mount Joy, PA 17552 and is currently estimated at $560,491, approximately $226 per square foot. 19 Dietz Ln is a home located in Lancaster County with nearby schools including Donegal Intermediate School, Donegal High School, and KELLY SCHOOL.
Ownership History
Date
Name
Owned For
Owner Type
Purchase Details
Closed on
Apr 12, 2011
Sold by
Becker Gregory H and Blouch Jacey L
Bought by
Gills Daniel E and Gills Kristin E
Current Estimated Value
Home Financials for this Owner
Home Financials are based on the most recent Mortgage that was taken out on this home.
Original Mortgage
$181,200
Outstanding Balance
$125,536
Interest Rate
4.89%
Mortgage Type
New Conventional
Estimated Equity
$434,955
Purchase Details
Closed on
Jul 31, 2009
Sold by
Landmark Builders Inc
Bought by
Becker Gregory H and Becker Jacey L
Home Financials for this Owner
Home Financials are based on the most recent Mortgage that was taken out on this home.
Original Mortgage
$221,500
Interest Rate
5.21%
Mortgage Type
New Conventional
Purchase Details
Closed on
Apr 7, 2009
Sold by
Steudler Frederick W and Steudler Fred
Bought by
Landmark Builders Inc
Create a Home Valuation Report for This Property
The Home Valuation Report is an in-depth analysis detailing your home's value as well as a comparison with similar homes in the area
Home Values in the Area
Average Home Value in this Area
Purchase History
| Date | Buyer | Sale Price | Title Company |
|---|---|---|---|
| Gills Daniel E | $266,500 | None Available | |
| Becker Gregory H | $276,940 | None Available | |
| Landmark Builders Inc | $50,900 | None Available |
Source: Public Records
Mortgage History
| Date | Status | Borrower | Loan Amount |
|---|---|---|---|
| Open | Gills Daniel E | $181,200 | |
| Previous Owner | Becker Gregory H | $221,500 |
Source: Public Records
Tax History Compared to Growth
Tax History
| Year | Tax Paid | Tax Assessment Tax Assessment Total Assessment is a certain percentage of the fair market value that is determined by local assessors to be the total taxable value of land and additions on the property. | Land | Improvement |
|---|---|---|---|---|
| 2025 | $8,029 | $316,100 | $66,500 | $249,600 |
| 2024 | $8,029 | $316,100 | $66,500 | $249,600 |
| 2023 | $7,999 | $316,100 | $66,500 | $249,600 |
| 2022 | $7,939 | $316,100 | $66,500 | $249,600 |
| 2021 | $7,631 | $309,600 | $66,500 | $243,100 |
| 2020 | $7,631 | $309,600 | $66,500 | $243,100 |
| 2019 | $7,491 | $309,600 | $66,500 | $243,100 |
| 2018 | $5,496 | $309,600 | $66,500 | $243,100 |
| 2017 | $7,347 | $243,700 | $43,400 | $200,300 |
| 2016 | $7,347 | $243,700 | $43,400 | $200,300 |
| 2015 | $1,873 | $243,700 | $43,400 | $200,300 |
| 2014 | $5,367 | $243,700 | $43,400 | $200,300 |
Source: Public Records
Map
Nearby Homes
- Carter Plan at Florin Hill - Single Family
- Dundee Plan at Florin Hill - Single Family
- Marlow Plan at Florin Hill - Single Family
- Elgin Plan at Florin Hill - Single Family
- Andover Plan at Florin Hill - Single Family
- Anders Plan at Florin Hill - Single Family
- Darby Plan at Florin Hill - Single Family
- Arundel Plan at Florin Hill - Single Family
- Bromley Plan at Florin Hill - Single Family
- Helston Plan at Florin Hill - Single Family
- 104 Merchant Ave Unit ANDOVER
- 104 Merchant Ave Unit MARLOW
- 104 Merchant Ave Unit ELGIN
- 104 Merchant Ave Unit DUNDEE
- 104 Merchant Ave Unit ANDERS
- 104 Merchant Ave Unit ARUNDEL
- 104 Merchant Ave Unit CARTER
- 104 Merchant Ave Unit HELSTON
- 104 Merchant Ave Unit BROMLEY
- 104 Merchant Ave Unit DARBY