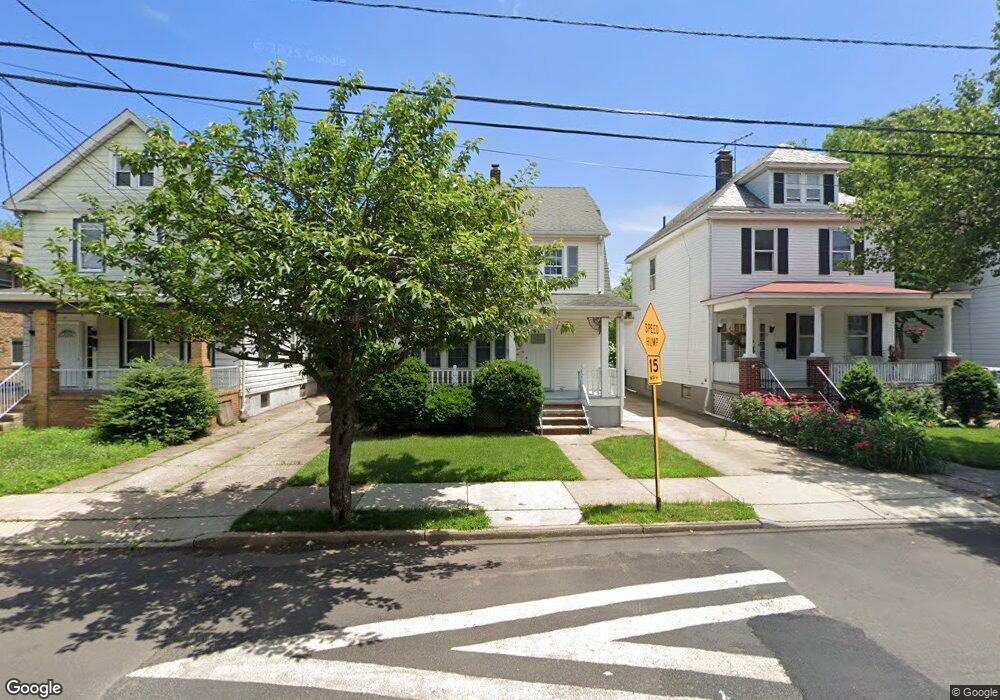
19 Dix St New Brunswick, NJ 08901
Estimated Value: $463,000 - $586,000
3
Beds
1
Bath
1,323
Sq Ft
$396/Sq Ft
Est. Value
About This Home
This home is located at 19 Dix St, New Brunswick, NJ 08901 and is currently estimated at $523,561, approximately $395 per square foot. 19 Dix St is a home located in Middlesex County with nearby schools including New Brunswick High School and Central Jersey College Prep Charter School.
Ownership History
Date
Name
Owned For
Owner Type
Purchase Details
Closed on
Jun 29, 2012
Sold by
Wolfe Henry and Sodikoff Genese
Bought by
Zhang Dianguo and Fu Linghong
Current Estimated Value
Home Financials for this Owner
Home Financials are based on the most recent Mortgage that was taken out on this home.
Original Mortgage
$252,000
Outstanding Balance
$37,296
Interest Rate
3.04%
Mortgage Type
New Conventional
Estimated Equity
$486,265
Purchase Details
Closed on
Oct 7, 2005
Sold by
Holzman Kevin
Bought by
Wolfe Henry and Sodikoff Genese
Home Financials for this Owner
Home Financials are based on the most recent Mortgage that was taken out on this home.
Original Mortgage
$300,000
Interest Rate
5.79%
Purchase Details
Closed on
Nov 2, 1998
Sold by
Gross John
Bought by
Gross Doreen and Holzman Kevin
Home Financials for this Owner
Home Financials are based on the most recent Mortgage that was taken out on this home.
Original Mortgage
$139,500
Interest Rate
6.68%
Create a Home Valuation Report for This Property
The Home Valuation Report is an in-depth analysis detailing your home's value as well as a comparison with similar homes in the area
Home Values in the Area
Average Home Value in this Area
Purchase History
| Date | Buyer | Sale Price | Title Company |
|---|---|---|---|
| Zhang Dianguo | $336,000 | First American Title Ins Co | |
| Wolfe Henry | $375,000 | -- | |
| Gross Doreen | $3,015,500 | -- |
Source: Public Records
Mortgage History
| Date | Status | Borrower | Loan Amount |
|---|---|---|---|
| Open | Zhang Dianguo | $252,000 | |
| Previous Owner | Wolfe Henry | $300,000 | |
| Previous Owner | Gross Doreen | $139,500 |
Source: Public Records
Tax History Compared to Growth
Tax History
| Year | Tax Paid | Tax Assessment Tax Assessment Total Assessment is a certain percentage of the fair market value that is determined by local assessors to be the total taxable value of land and additions on the property. | Land | Improvement |
|---|---|---|---|---|
| 2025 | $8,624 | $329,300 | $176,000 | $153,300 |
| 2024 | $8,374 | $329,300 | $176,000 | $153,300 |
| 2023 | $8,374 | $329,300 | $176,000 | $153,300 |
| 2022 | $8,196 | $329,300 | $176,000 | $153,300 |
| 2021 | $6,081 | $329,300 | $176,000 | $153,300 |
| 2020 | $8,134 | $329,300 | $176,000 | $153,300 |
| 2019 | $7,979 | $329,300 | $176,000 | $153,300 |
| 2018 | $7,798 | $329,300 | $176,000 | $153,300 |
| 2017 | $7,488 | $329,300 | $176,000 | $153,300 |
| 2016 | $7,127 | $121,500 | $37,200 | $84,300 |
| 2015 | $6,957 | $121,500 | $37,200 | $84,300 |
| 2014 | $6,833 | $121,500 | $37,200 | $84,300 |
Source: Public Records
Map
Nearby Homes